
CL Educate Limited
CL Educate Limited gets ready to expand and set new records, it seems like a wise long-term investment.
Please review and comprehend the weekly chart for CL Educate Limited. The chart indicates that CL Educate Limited, which has had outstanding performance thus far, is a wise investment in the 120-130 zone, which it enters after any slump. It also provides numerous opportunities for growth.
Please refer to CL Educate Limited's weekly chart. The stock is getting ready to break out of the ascending triangle formation and soaring quickly above the trendline support. The anticipated upward open range as shown is between 230 and 250 in the chart below. According to the report, there is currently a significant demand.
- CL Educate Limited is now doing well and has good trendline support, it is an excellent long-term investment prospect.
- The favorable position of CL Educate Limited may allow it to expand and achieve its objectives between 230 and 250.
- Since the risk-reward ratio is suitable for cash transactions, the best time to purchase the stock is between 120 and 130.
- The chart shows that the stock is poised for a massive breakout, with a target price between 230 and 250, as it breaks out of an ascending triangle pattern.
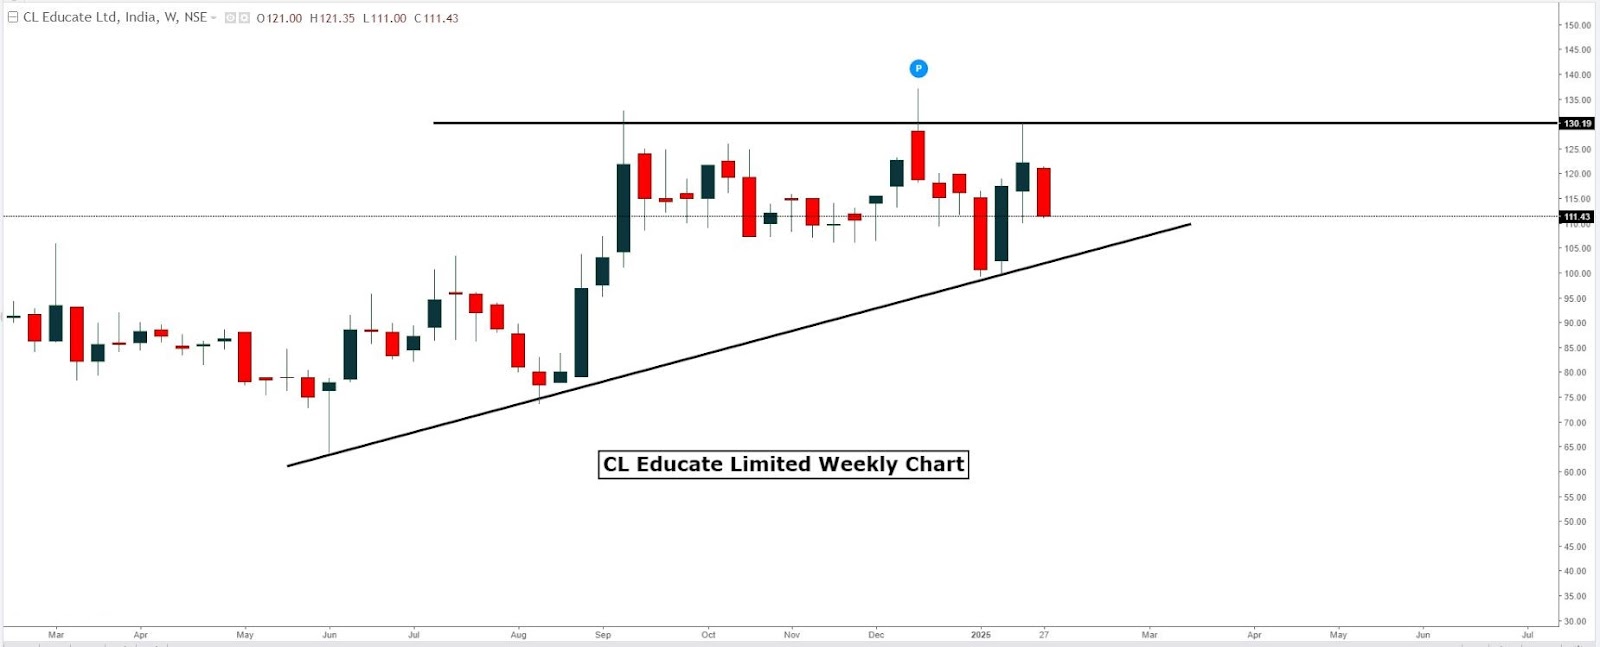
Please find attached the weekly chart for CL Educate Limited. In addition to an upward breakout and trendline support, the weekly chart shows demand. The rising demand is reflected in the stock price.
The stock's historical record indicates that now is a good time to buy it at the current price, even after the breakout post horizontal resistance. Consequently, keep an eye out for the horizontal resistance breakthrough in the 120-130 area. Demand has risen as of this writing and may approach the anticipated range of 230–250.
The current objectives of CL Educate Limited range from 230 to 250. The structure of the organization was based on the rising triangle. In technical analysis, the rising triangle is a frequently utilized chart pattern. A rising trend line and a horizontal line are the results of price changes at the swing high and low, respectively. Between these two lines, a triangle is formed.
Investors may be looking for long-term purchasing opportunities in the 120-130 range due to the high demand for the stock. Because of its remarkable risk-reward profile, this company should see a boost in value during market downturns. Don't pass up the chance to purchase this stock. Invest in this company; it has a lot of potential, even in recessions.
Rich investors can buy as much stock as they need and try to sell it between 230 and 250, with a stop loss at about 102.
The stock or instrument may climb quickly on the upside with heavy volume and surpass the goal if there is no price movement prior to a discernible increase. Traders and investors are still interested in the volatility contraction patterns, or VCPs. To discover more about VCP patterns, visit our website or download the FxCareers app from the Google Play Store. We also provide precise pattern identification.
The weekly chart of CL Educate Limited shows both resistance and support. The spot chart displays each level.
|
CL Educate |
Support |
Resistance |
|
Level 1 |
120 |
230 |
|
Level 2 |
102 |
250 |
Company Profile: CL Educate Ltd serves students of all ages and concentrates on a variety of educational areas. Over its more than 25 years in business, CL Educate Ltd. has influenced the lives and careers of countless students under the direction of a group of highly skilled professionals, including IIT-IIM alumni, who are passionate about providing high-quality education.
Disclaimer: This expression is commonly used to convey that the content or material being seen is solely for educational reasons and should not be utilized for anything else. This example is just for educational purposes and should not be used commercially.