
Ashapura Minechem
Ashapura Minechem Limited continues to grow and break records, it appears to be a prudent long-term investment.
Kindly go over and understand the Ashapura Minechem Limited weekly chart. Ashapura Minechem Limited, which has so far produced remarkable returns, is a smart investment in the 470-480 zone, which it enters at any dip, according to the chart. It also offers a lot of chances for development.
Please refer to the weekly chart provided by Ashapura Minechem Limited. The stock is currently rising quickly and trading above horizontal resistance after leaving the 470-480 range. According to the research, there is currently a significant demand at 540 levels. The chart below shows the expected upward open range, which is between 980 and 1000.
- Ashapura Minechem Limited expanded and is currently a great long-term investment potential following a significant breakthrough in the 470–480 zone.
- Ashapura Minechem Limited may be able to grow and accomplish its goals between 980 and 1000 due to its advantageous location.
- Because the risk-reward ratio is appropriate for cash transactions, the optimum moment to buy the stock is right now, when it is between 470 and 480.
- The stock is emerging from an ascending triangle formation, according to the chart, and its target price is between 980 and 1000.
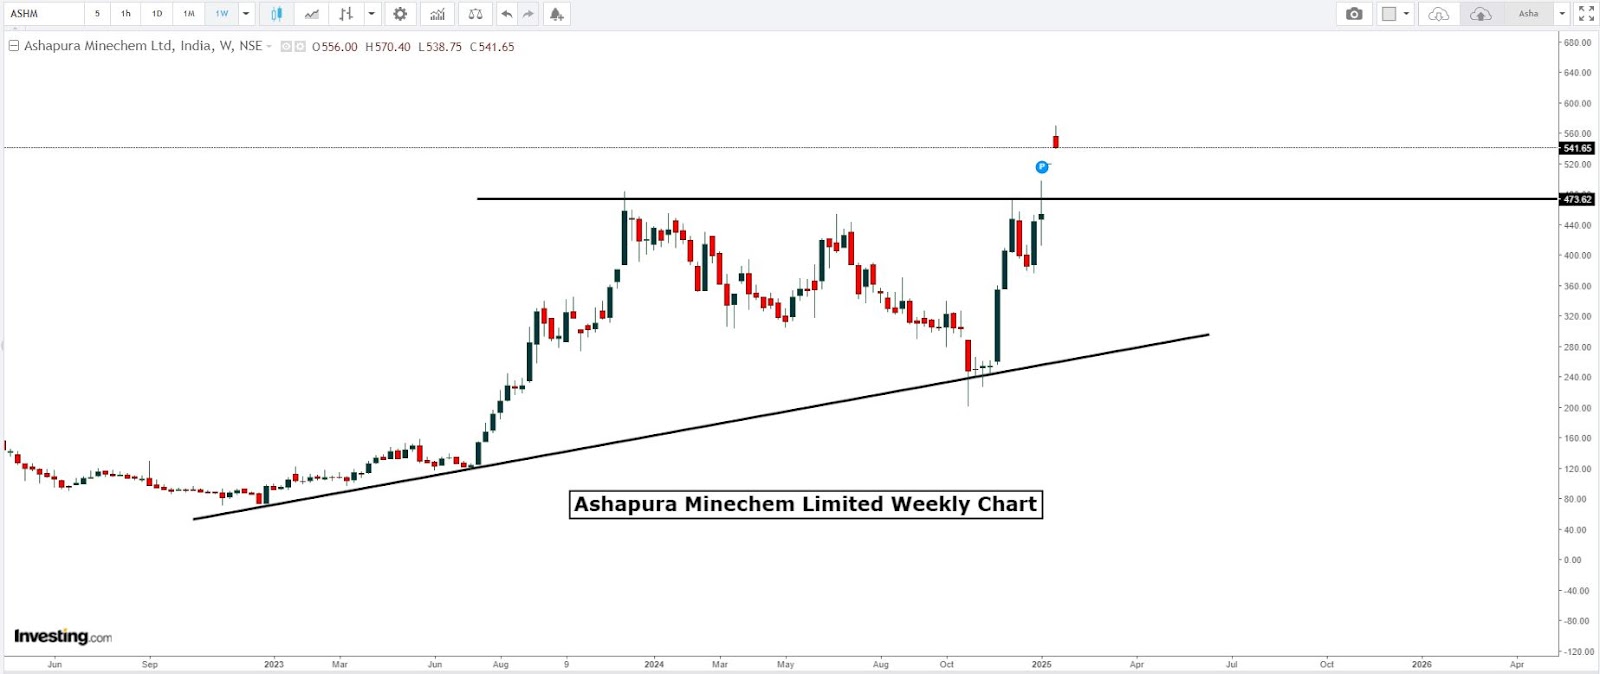
The Ashapura Minechem Limited weekly chart is attached. The weekly chart displays demand between 470 and 480, where an upward breakthrough and horizontal resistance are present. The stock price reflects the increasing demand.
It looks like a decent moment to purchase the stock at the current price given its recent peak. Watch for the horizontal resistance to break as a result. The demand has increased as of this writing and could be close to the 980–1000 range that was predicted.
Ashapura Minechem Limited currently has between 980 and 1000 goals. The rising triangle served as the foundation for the organization's structure. The rising triangle is an often used chart pattern in technical analysis. Price fluctuations at the swing high and low result in a rising trend line and a horizontal line, respectively. Between these two lines, a triangle is formed.
Because of the strong demand for the stock, investors might be searching for long-term buying opportunities in the 470–480 range. During market downturns, this company's value should increase due to its exceptional risk-reward profile. Don't miss the opportunity to buy this stock. Invest in this business; even during recessions, it has a lot of potential.
Rich investors can purchase as much stock as they require, place a stop loss at roughly 290, and attempt to sell it between 980 and 1000.
The stock or instrument may climb quickly on the upside with heavy volume and surpass the objective if there is no price movement prior to a discernible increase. VCPs, or volatility contraction patterns, are still of relevance to traders and investors. To find out more about VCP patterns, visit our website or download the FxCareers app from the Google Play Store. We also provide precise pattern recognition.
The weekly chart of Ashapura Minechem Limited shows both support and resistance. The spot chart displays every level.
|
Ashapura Minechem |
Support |
Resistance |
|
Level 1 |
480 |
980 |
|
Level 2 |
470 |
1000 |
Company Profile: Ashapura Minechem Ltd. was founded on February 19, 1982, and is involved in the mining, production, and distribution of a variety of minerals and their derivatives. From soaps to steel, energy to edible oils, metal to medicine, and cement to ceramics, the company provides multi-mineral solutions for a variety of industries. The company operates in seven other countries in addition to India.
Disclaimer: This expression is commonly used to convey that the content or material being seen is solely for educational reasons and should not be utilized for anything else. This example is just for educational purposes and should not be used commercially.