
Oriental Hotels Limited
Oriental Hotels Limited is still expanding and setting new records, it seems like a prudent long-term investment.
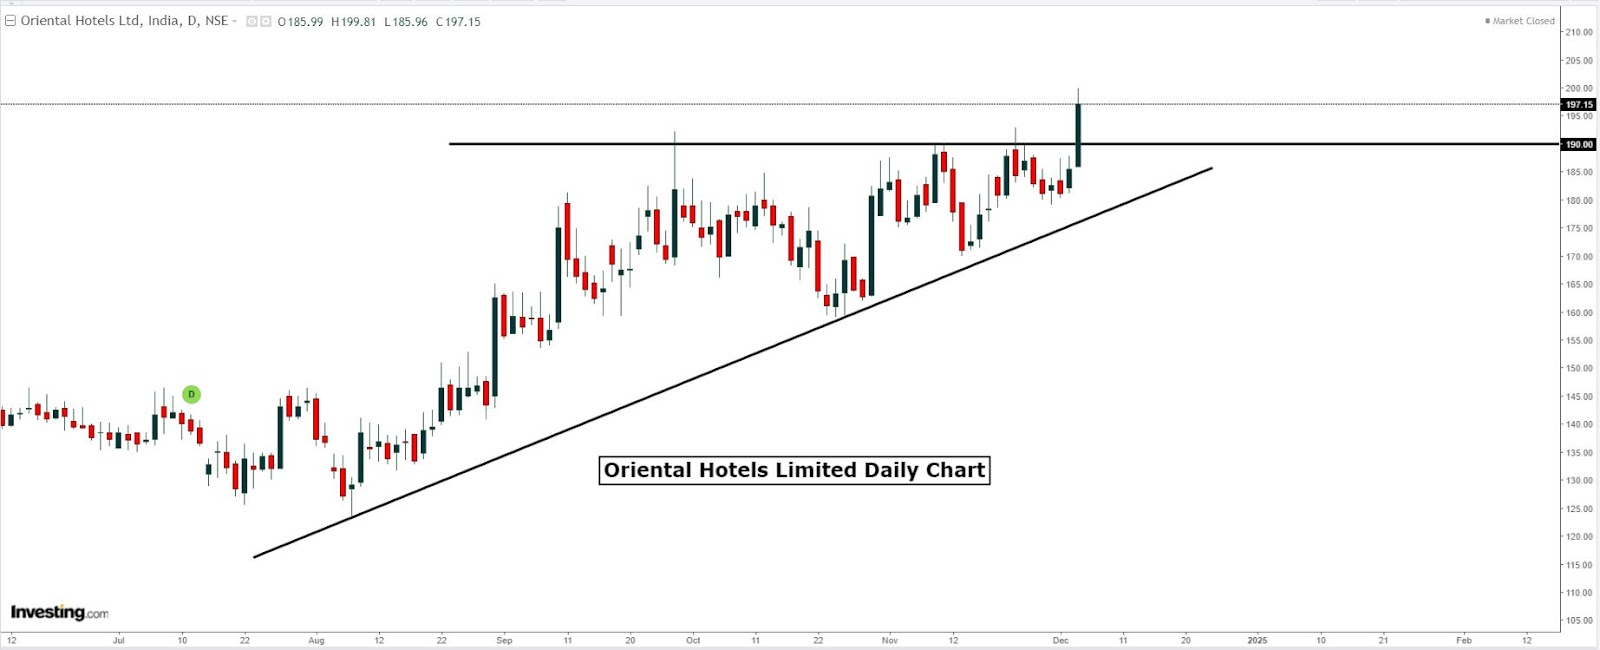
Kindly take a moment to review and understand the Oriental Hotels Limited daily chart. The chart indicates that Oriental Hotels Limited has done well so far and is a good buy in the 190-195 zone, where it trades on all dips. It also offers a plethora of chances for development.
Please refer to the daily chart for Oriental Hotels Limited. The stock is currently increasing quickly and trading over the horizontal barrier after breaking out of the 190-195 region. According to the data, there is currently a noticeable demand at 195 levels. The chart below shows the predicted upward open range, which is between 280 and 300.
- Oriental Hotels Limited has expanded and is currently an excellent long-term investment possibility after making a significant breakthrough in the 190-195 zone.
- Oriental Hotels Limited's strategic location may allow it to grow and achieve its 280 and 300 goals.
- Right now, while the stock is trading between 190 and 195, is the ideal time to buy because the risk-reward ratio is appropriate for cash transactions.
- The chart shows that the stock has broken out of an ascending triangle formation, and its target price is between 280 and 300.
Please find attached Oriental Hotels Limited's chart. The daily chart indicates that demand is located between prices of 190 and 195, with an upward breakthrough and horizontal resistance. The stock price is a good indicator of growing demand.
This seems like a decent time to buy at the current price, especially in light of the stock's recent top. It is therefore important to keep an eye out for the horizontal resistance breakthrough retest zone. As I write this, the stock is rising and could finally hit the expected range of 280-300.
Oriental Hotels Limited has established new targets that fall between 280 and 300. The structural underpinning of the firm was provided by the Ascending triangle. The ascending triangle is an often used chart pattern in technical analysis. Price movements at the swing highs and higher lows result in an upward-sloping trendline and a horizontal resistance, respectively. These two lines create a triangle.
Given the significant demand for the stock, investors might be searching for long-term buying opportunities in the 190-195 range. During market downturns, this company's value should increase due to its exceptional risk-reward profile. Seize the opportunity to buy this stock. Invest in this business; even during recessions, it has a lot of potential.
Rich buyers can buy the minimal amount of the stock and set up a sell order with a stop loss at 175 and a price range of 280 to 300.
The stock or instrument may rise quickly on the upside with large volume and surpass the target if there is no price movement prior to a discernible increase. Traders and investors are still intrigued by the volatility contraction patterns, or VCPs. For additional information on VCP patterns, visit our website or download the Fx Careers app from the Google Play Store. Additionally, we offer accuracy in pattern identification.
The daily chart of Oriental Hotels Limited shows both resistance and support. The spot chart shows all of the levels.
|
Oriental Hotels |
Support |
Resistance |
|
Level 1 |
190 |
280 |
|
Level 2 |
175 |
300 |
Company Profile: The Indian Hotels corporation Limited (IHCL) is the parent corporation of Oriental Hotels Limited. Vivanta Coimbatore, Vivanta Mangalore, The Gateway Hotel Pasumalai, Madurai, Taj Fisherman's Cove Resort & Spa, Chennai, Taj Coromandel, Chennai, and Gateway Coonoor, an IHCL SeleQtions hotel, are the company's seven properties.
Disclaimer: This expression is commonly used to convey that the content or material being seen is solely for educational reasons and should not be utilized for anything else. This example is just for educational purposes and should not be used commercially.