Asia - Forex Technical Outlook and Review | 19 December 2023
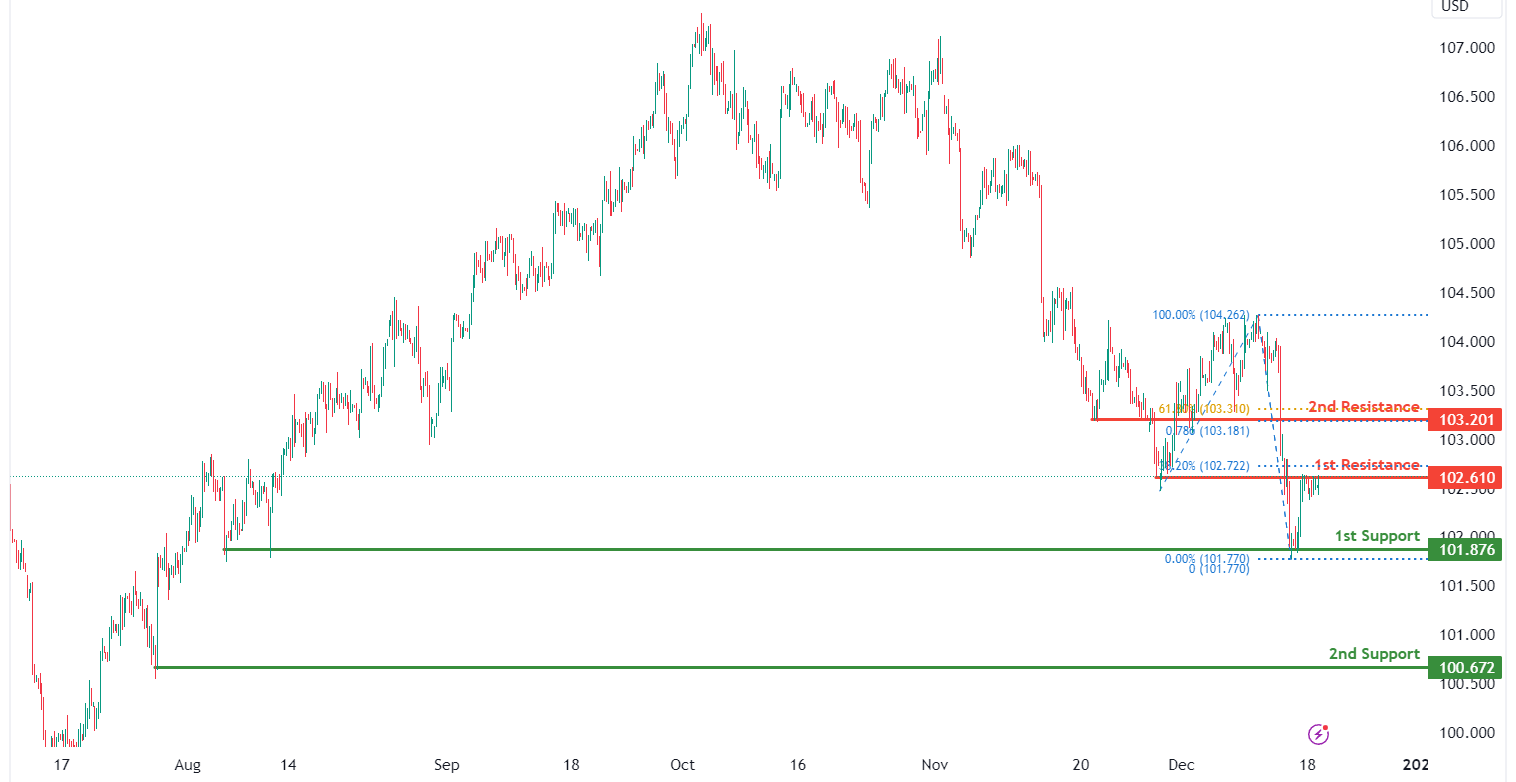
DXY:
The DXY (US Dollar Index) chart currently shows an overall bearish momentum, indicating a potential for price to make a bearish reaction off the 1st resistance and fall towards the 1st support.
The 1st resistance level at 102.61 is identified as an overlap resistance that aligns close to the 38.20% Fibonacci retracement level. Higher up, the 2nd resistance level at 103.20 is also marked as an overlap resistance that aligns with a confluence of Fibonacci levels i.e. the 61.80% retracement and the 78.60% projection levels, suggesting a potential barrier for further upside movement.
To the downside, the 1st support level at 101.87 is identified as a multi-swing-low support. Further below, the 2nd support level at 100.67 is noted as a swing-low, further reinforcing its importance as a potential key support level.
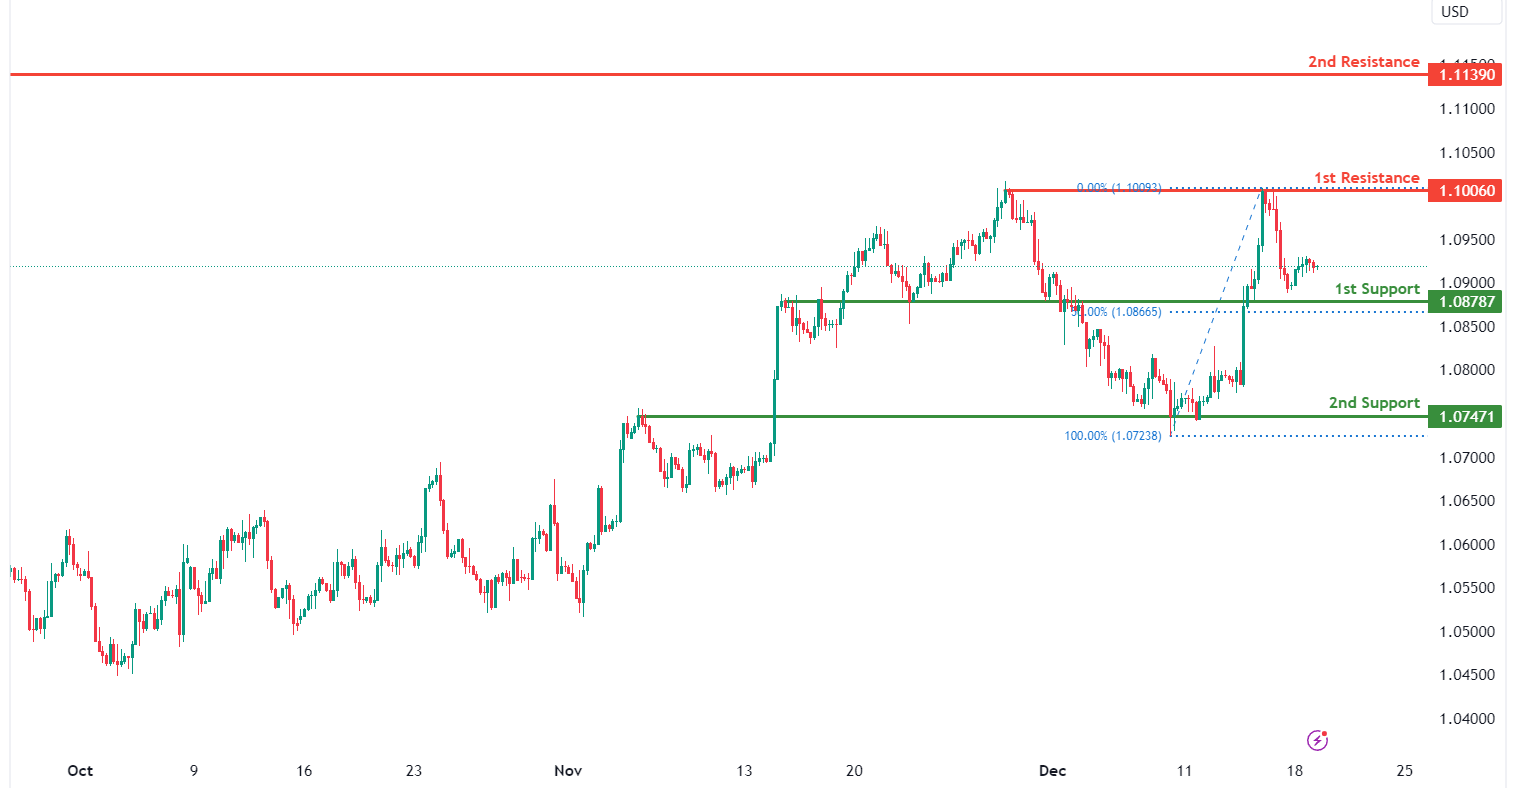
EUR/USD:
The EUR/USD chart currently exhibits an overall bearish momentum. In this context, there is a potential scenario for price to make a bearish continuation towards the 1st support.
The 1st support level at 1.0878 is identified as an overlap support that aligns close to the 50.00% Fibonacci retracement level. Further below, the 2nd support level at 1.0747 is also marked as an overlap support, further reinforcing its importance as a potential key support level.
To the upside, the 1st resistance level at 1.1006 is identified as a multi-swing-high resistance. Higher up, the 2nd resistance level at 1.1139 is noted as a swing-high resistance, suggesting a potential barrier for further upside movement.
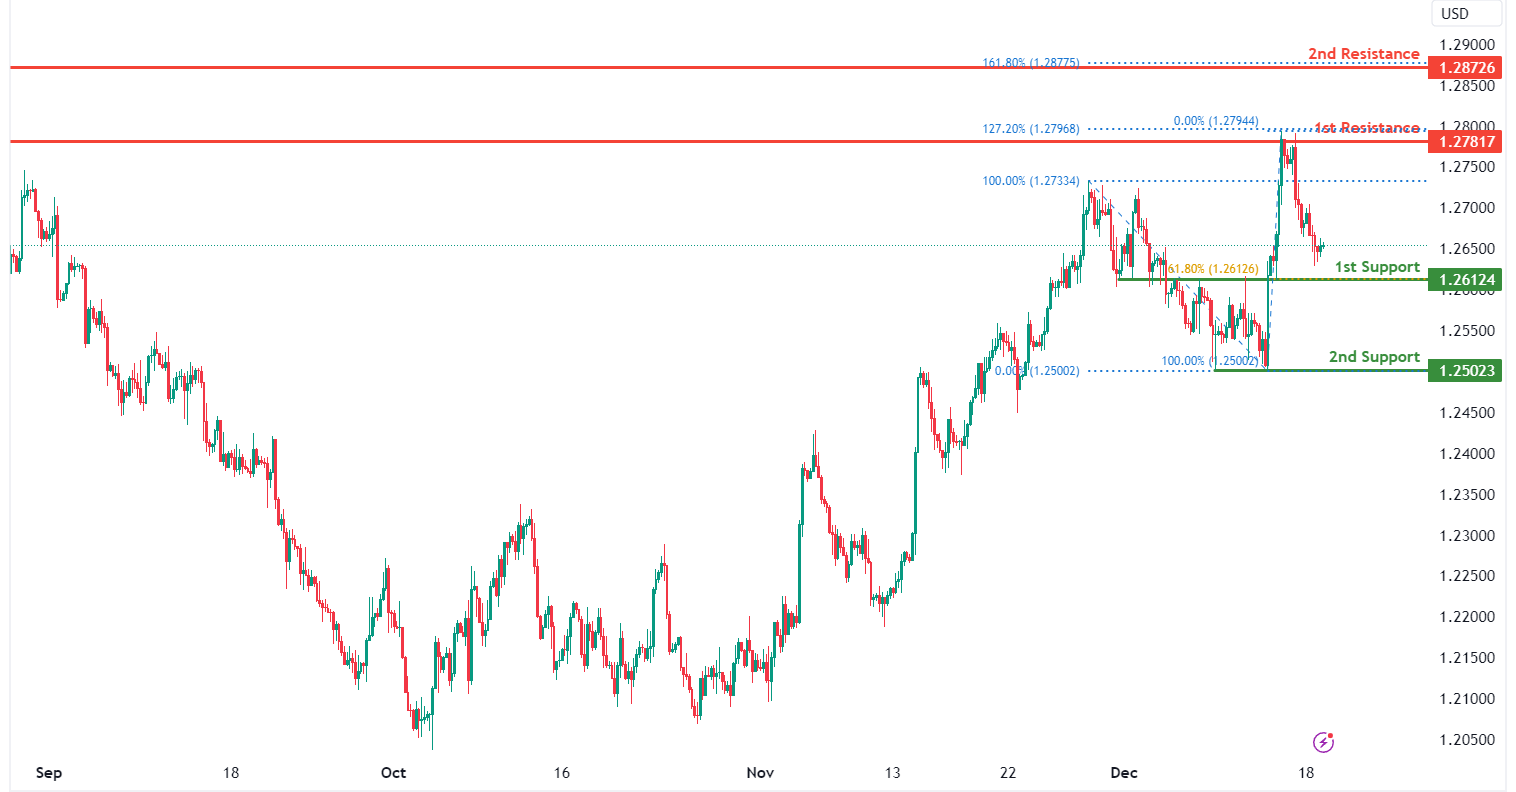
GBP/USD:
The GBP/USD chart currently exhibits an overall bearish momentum. In this context, there is a potential scenario for price to make a bearish continuation towards the 1st support.
The 1st support level at 1.2612 is identified as an overlap support that aligns with the 61.80% Fibonacci retracement level. Further below, the 2nd support level at 1.2502 is marked as a swing-low support, further reinforcing its importance as a potential key support level.
To the upside, the 1st resistance level at 1.2781 is identified as a multi-swing-high resistance that aligns with the 127.20% Fibonacci extension level. Higher up, the 2nd resistance level at 1.2872 is noted as a pullback resistance that aligns with the 161.80% Fibonacci extension level, suggesting a potential barrier for further upside movement.
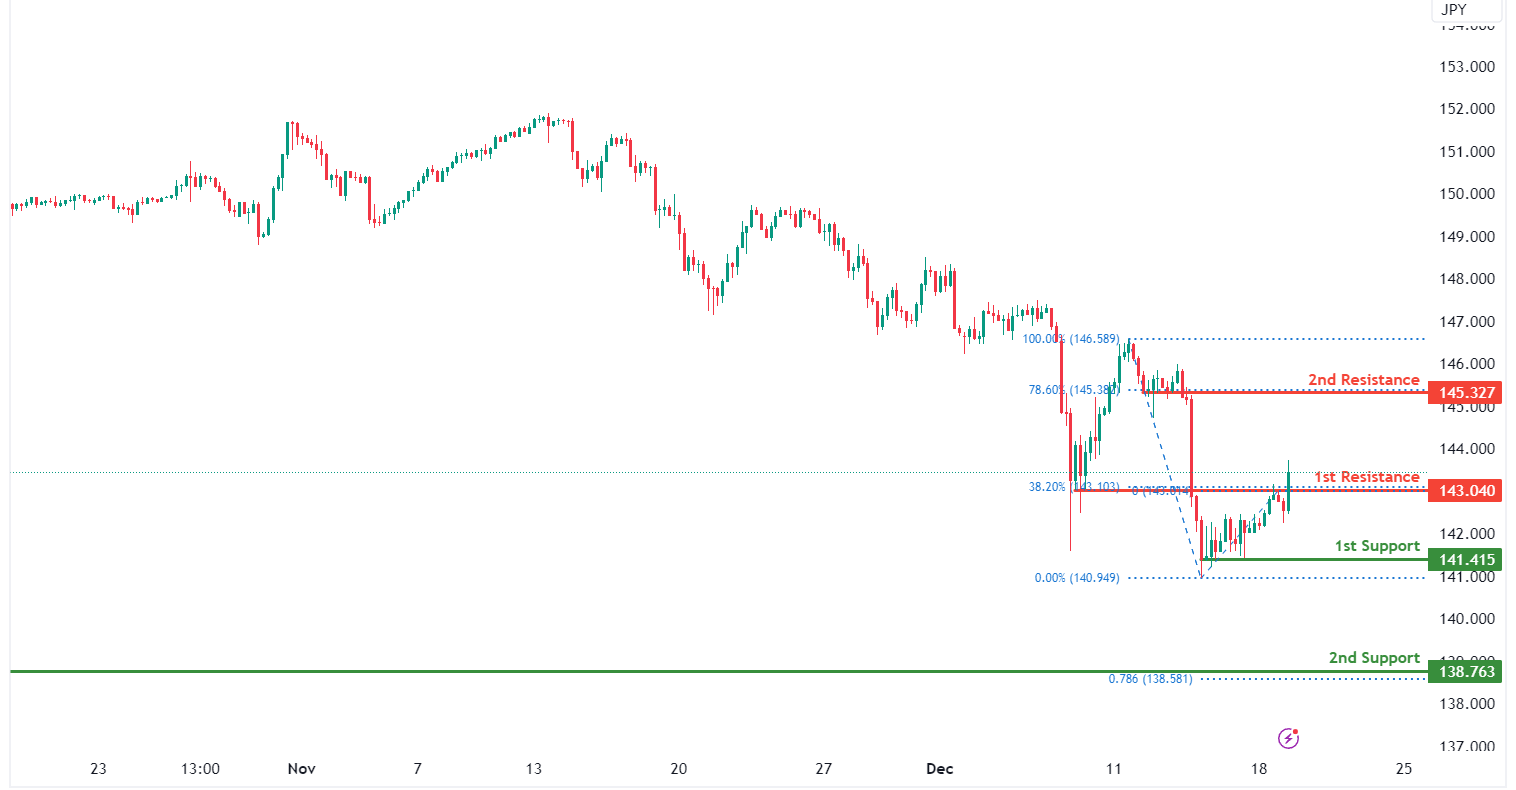
USD/JPY:
The USD/JPY chart currently exhibits an overall bullish momentum, indicating a potential for price to break above the 1st resistance and make a bullish continuation towards the 2nd resistance.
The 1st resistance level at 143.04 is identified as an overlap resistance that aligns with the 38.20% Fibonacci retracement level. Higher up, the 2nd resistance level at 145.32 is marked as a pullback resistance that aligns with the 78.60% Fibonacci retracement level, suggesting a potential barrier for further upside movement.
To the downside, the 1st support level at 141.41 is identified as a pullback support. Further below, the 2nd support level at 138.76 is noted as a swing-low support that aligns with the 78.60% Fibonacci projection level, further reinforcing its importance as a key support level.
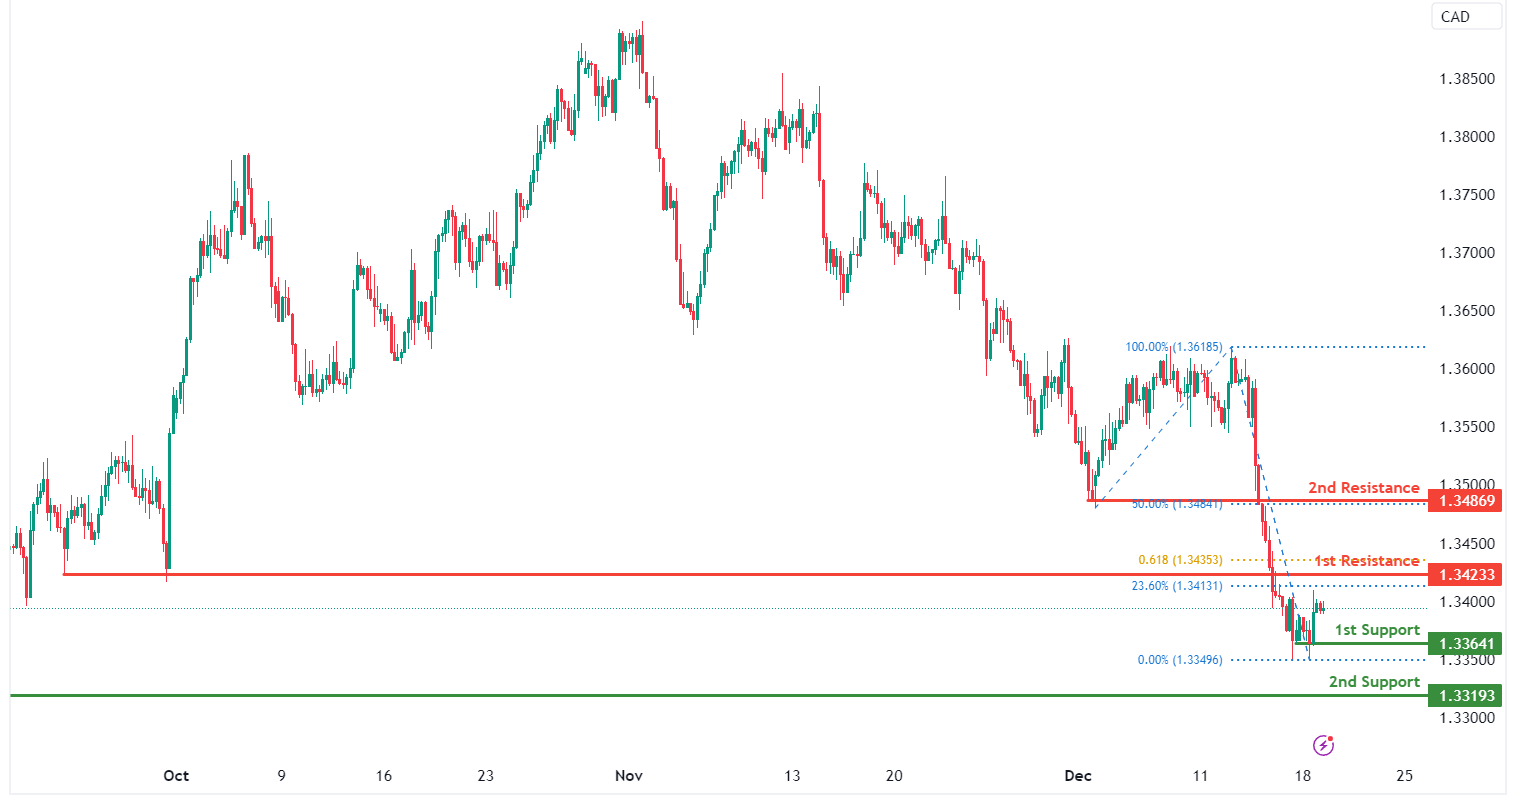
USD/CAD:
The USD/CAD chart currently exhibits an overall bearish momentum, indicating a potential for a drop towards the 1st support.
The 1st support level at 1.3364 is identified as a pullback support. Further below, the 2nd support level at 1.3319 is also noted as a pullback support, further reinforcing its importance as a key support level.
To the upside, the 1st resistance level at 1.3423 is identified as a pullback resistance that aligns with a confluence of Fibonacci levels i.e. the 23.60% retracement and the 61.80% projection levels. Higher up, the 2nd resistance level at 1.3486 is also marked as a pullback resistance that aligns with the 50.00% Fibonacci retracement level, suggesting a potential barrier for further upside movement.
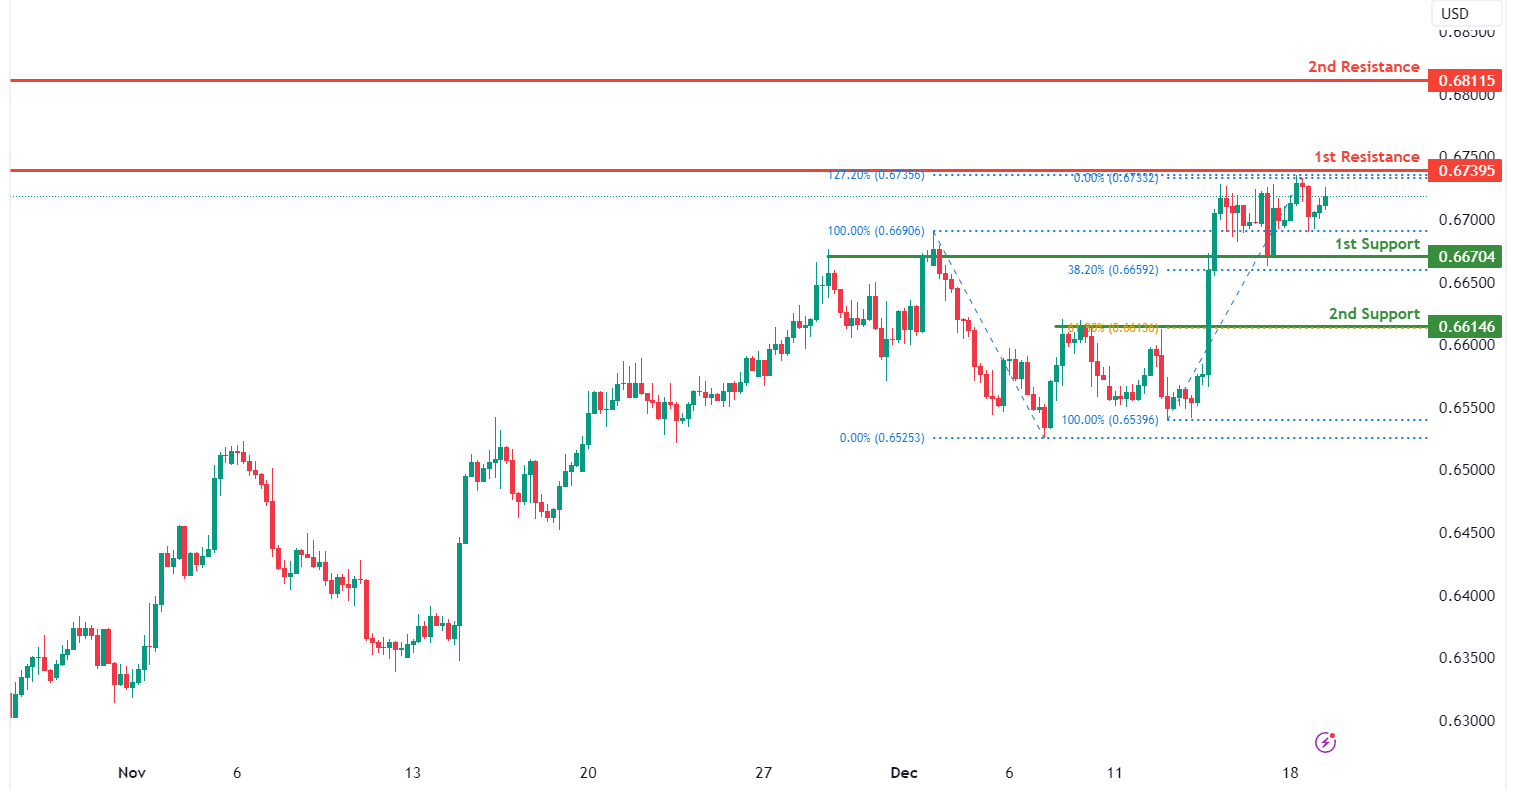
AUD/USD:
The AUD/USD chart currently exhibits an overall bullish momentum. In this context, there is a potential scenario for price to make a bullish continuation towards the 1st resistance.
The 1st resistance level at 0.6739 is identified as a swing-high resistance that aligns with the 127.20% Fibonacci extension level. Higher up, the 2nd resistance level at 0.6811 is also noted as a swing-high resistance, indicating its potential significance as a barrier for further upward movement.
To the downside, the 1st support level at 0.6670 is identified as an overlap support that aligns close to the 38.20% Fibonacci retracement level. Further below, the 2nd support level at 0.6614 is marked as a pullback support that aligns with the 61.80% Fibonacci retracement level, further reinforcing its importance as a key support level.
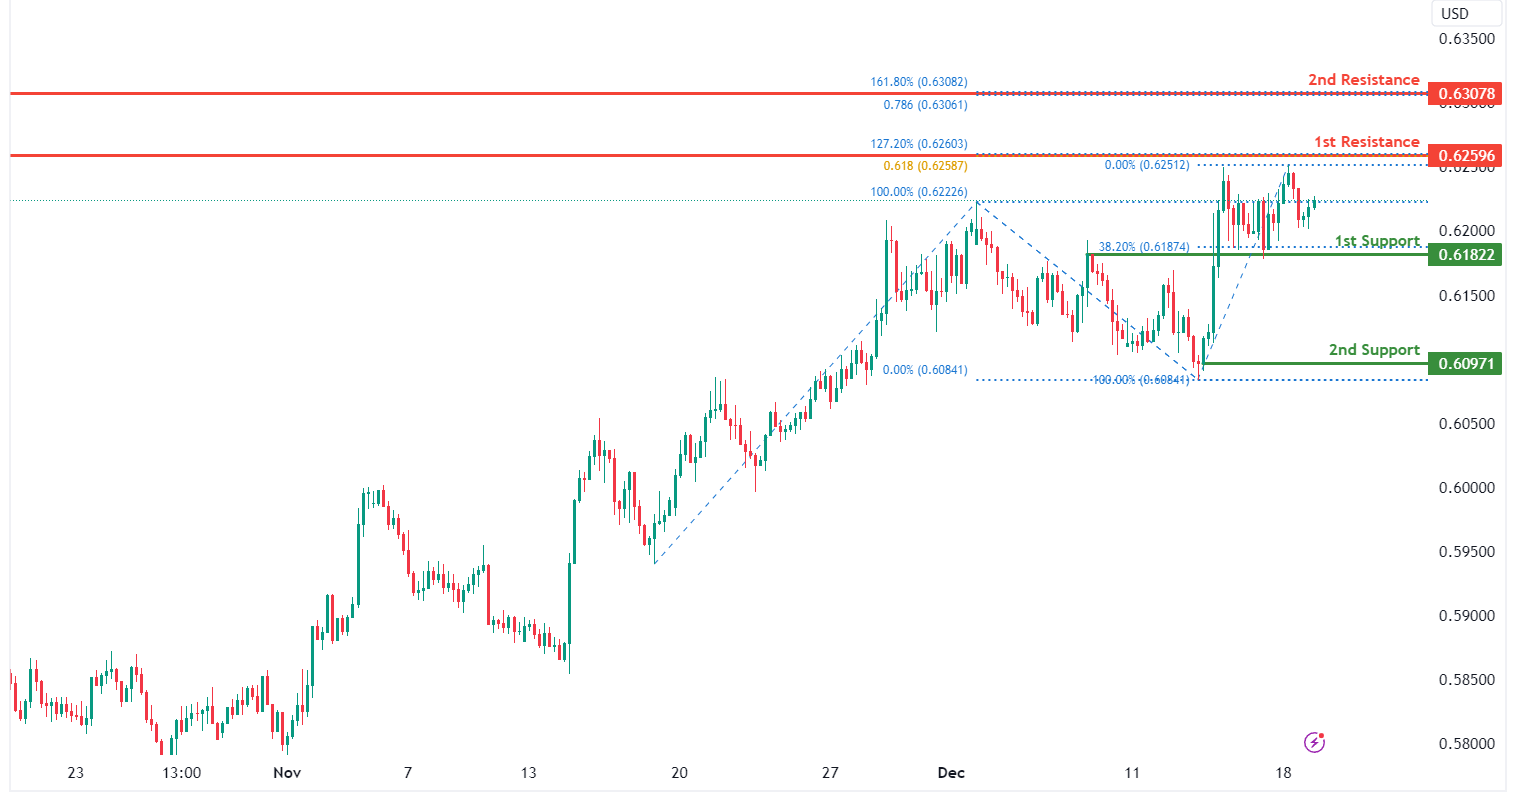
NZD/USD:
The NZD/USD chart currently exhibits an overall bullish momentum. In this context, there is a potential scenario for price to make a bullish continuation towards the 1st resistance.
The 1st resistance level at 0.6259 is identified as a swing-high resistance that aligns with a confluence of Fibonacci levels i.e. the 127.20% extension and the 61.80% projection levels. Higher up, the 2nd resistance level at 0.6307 is also marked as a swing-high resistance that aligns with a confluence of Fibonacci levels i.e. the 161.80% extension and the 78.60% projection levels, indicating its potential significance as a barrier for further upward movement.
To the downside, the 1st support level at 0.6182 is identified as an overlap support that aligns with the 38.20% Fibonacci retracement level. Further below, the 2nd support level at 0.6097 is noted as a swing-low support, further reinforcing its importance as a key support level.