
Asia - Forex Technical Outlook and Review | 18 December 2023
DXY:
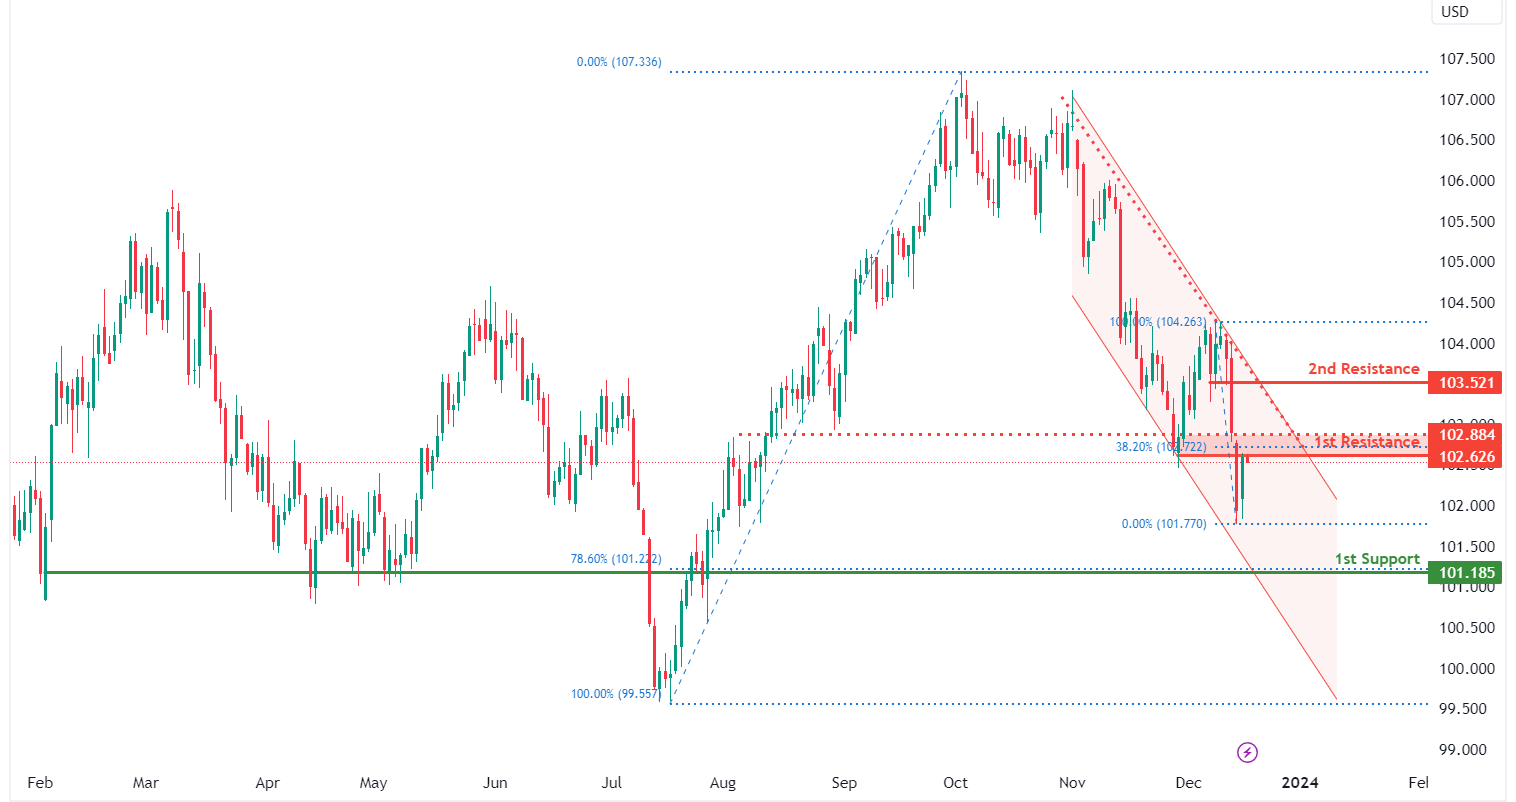
The DXY (US Dollar Index) chart currently shows an overall bearish momentum, indicating a potential for price to make a bearish reaction off the 1st resistance and fall towards the 1st support.
The 1st resistance level at 102.62 is identified as an overlap resistance that aligns close to the 38.20% Fibonacci retracement level. Higher up, the 2nd resistance level at 103.52 is marked as a pullback resistance, suggesting a potential barrier for further upside movement.
To the downside, the 1st support level at 101.18 is identified as a pullback support that aligns with the 78.60% Fibonacci retracement level, further reinforcing its importance as a potential key support level.
EUR/USD:
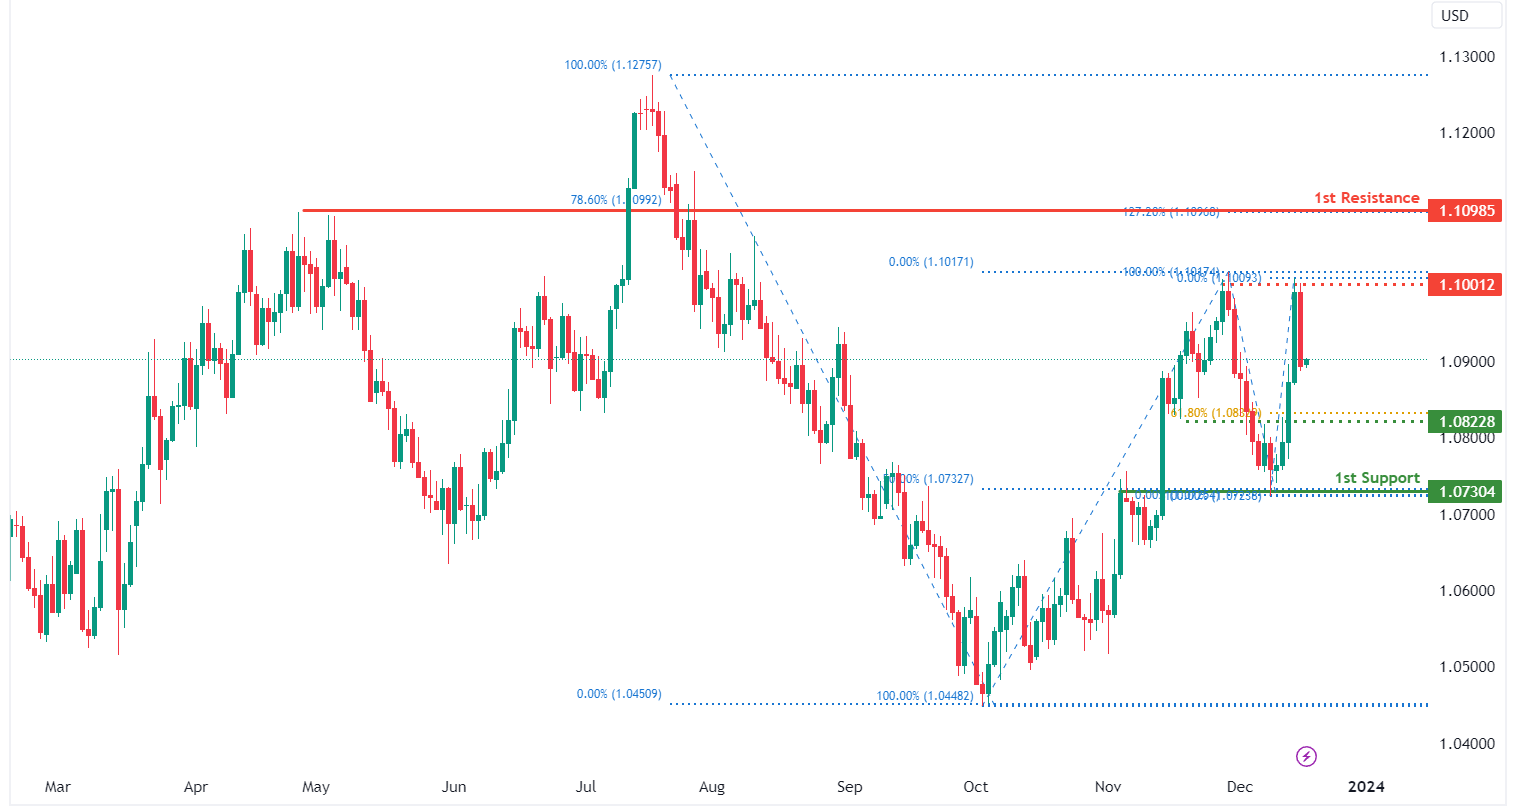
The EUR/USD chart currently exhibits an overall bullish momentum. However, there is a potential scenario for price to fluctuate between the intermediate resistance and intermediate support levels.
The intermediate resistance level at 1.1001 is identified as a pullback resistance. Higher up, the 1st resistance level at 1.1098 is also noted as a pullback resistance that aligns with a confluence of Fibonacci levels i.e. the 127.20% extension and the 78.60% retracement levels, suggesting a potential barrier for further upside movement.
To the downside, the intermediate support level at 1.0822 is identified as an overlap support that aligns close to the 61.80% Fibonacci retracement level. Further below. the 1st support level at 1.0730 is also marked as an overlap support that aligns with the 50.00% Fibonacci retracement level, further reinforcing its importance as a potential key support level.
GBP/USD:
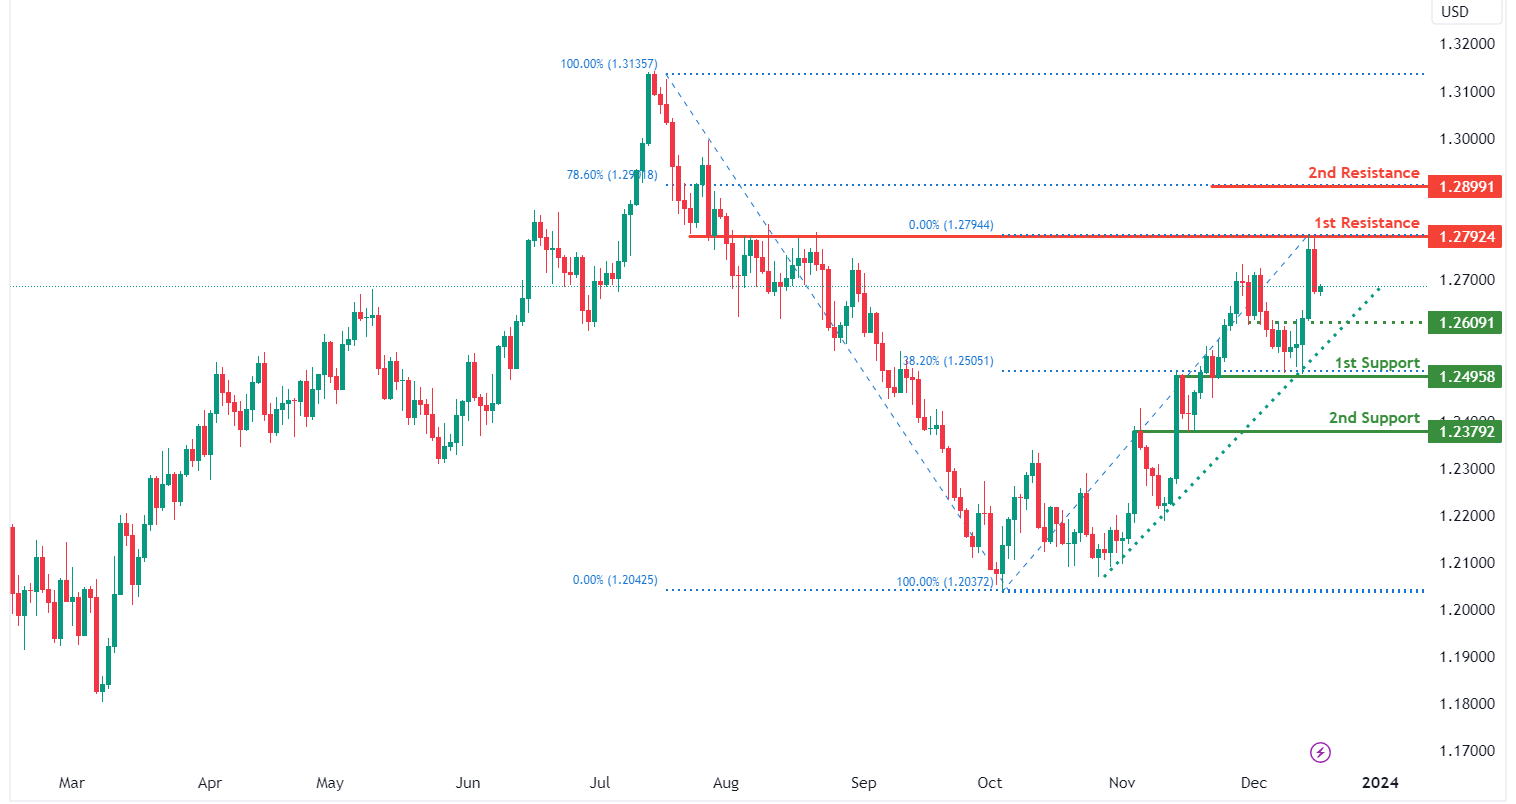
The GBP/USD chart currently exhibits an overall bullish momentum. In this context, there is a potential scenario for price to make a bullish continuation towards the 1st resistance.
The 1st resistance level at 1.2792 is identified as an overlap resistance. Higher up, the 2nd resistance level at 1.2899 is marked as a pullback resistance that aligns with the 78.60% Fibonacci retracement level, suggesting a potential barrier for further upside movement.
To the downside, the intermediate support level at 1.2609 is identified as an overlap support while the 1st support level at 1.2495 is also noted as an overlap support that aligns with the 38.20% Fibonacci retracement level. Further below, the 2nd support level at 1.2379 is marked as an overlap support, further reinforcing its importance as a potential key support level.
USD/JPY:
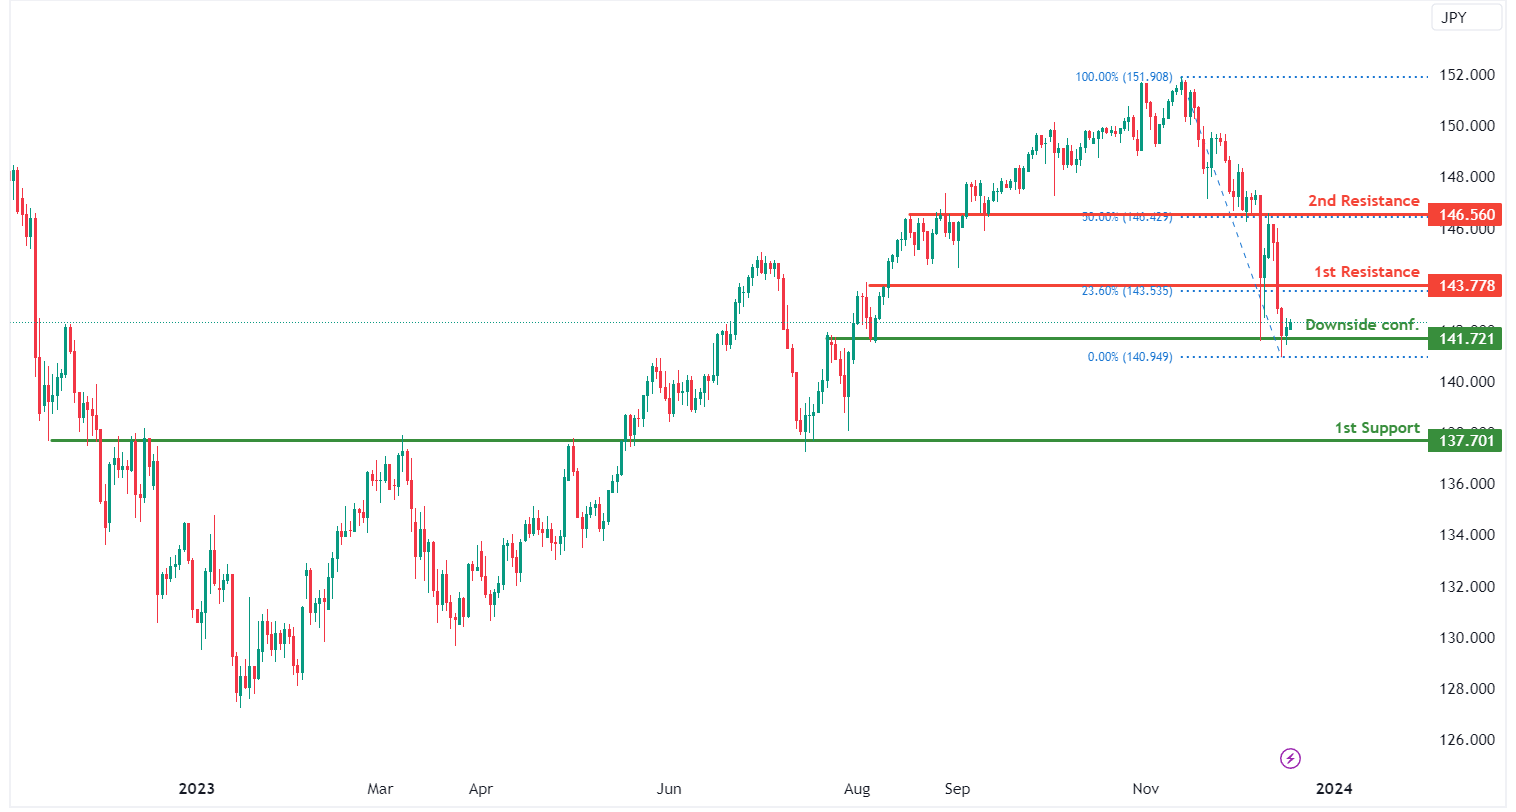
The USD/JPY chart currently exhibits an overall bearish momentum, indicating a potential for a drop towards the 1st support should price break below the downside confirmation level.
The downside confirmation level at 141.72 is identified as an overlap support. Further below, the 1st support level at 137.70 is also noted as an overlap support, further reinforcing its importance as a key support level.
To the upside, the 1st resistance level at 143.77 is identified as an overlap resistance that aligns with the 23.60% Fibonacci retracement level. Higher up, the 2nd resistance level at 146.56 is also marked as an overlap resistance that aligns with the 50.00% Fibonacci retracement level, suggesting a potential barrier for further upside movement.
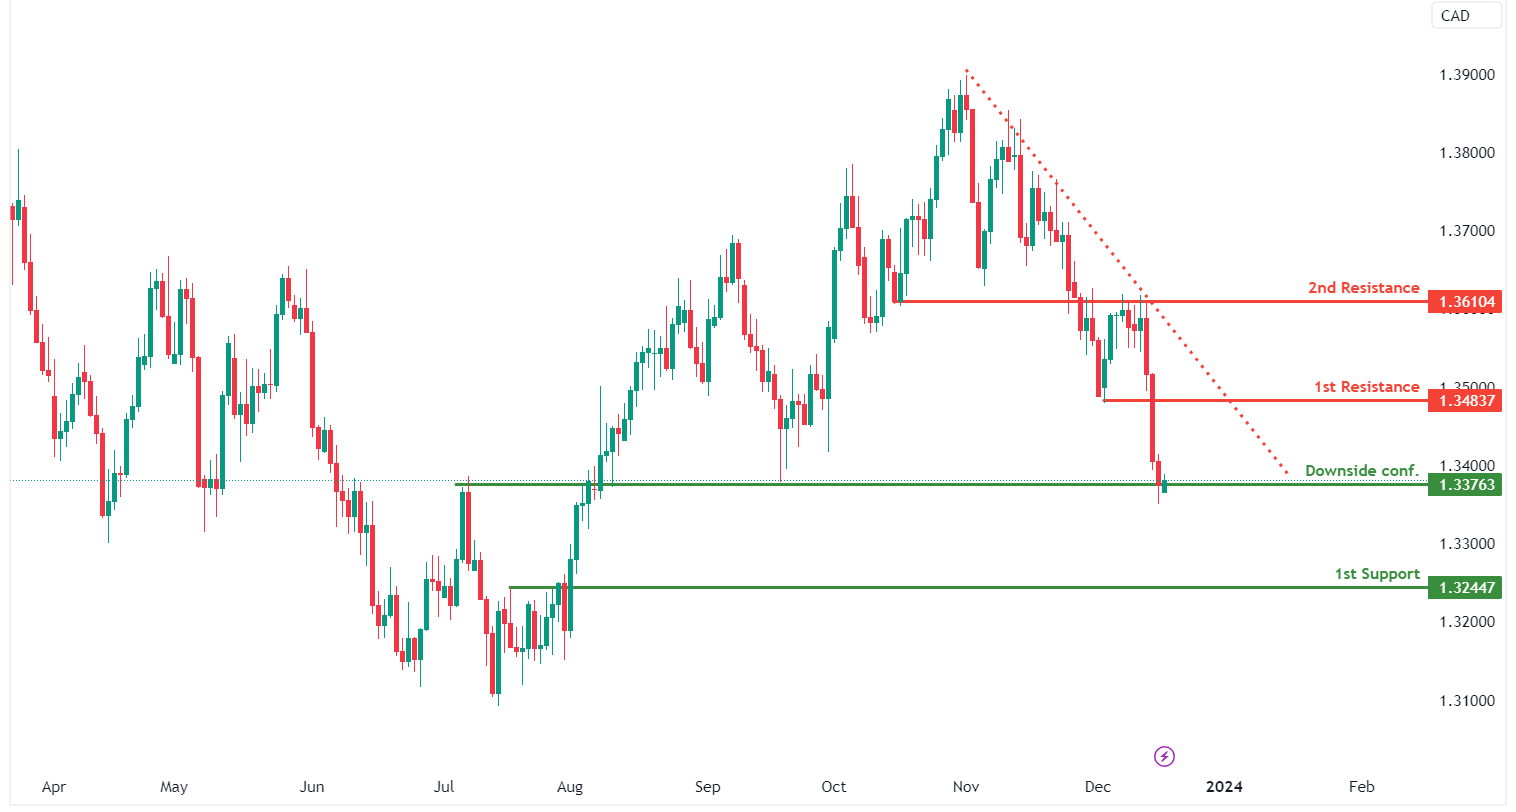
USD/CAD:
The USD/CAD chart currently exhibits an overall bearish momentum, indicating a potential for a drop towards the 1st support should price break below the downside confirmation level.
The downside confirmation level at 1.3376 is identified as an overlap support. Further below, the 1st support level at 1.3244 is noted as a pullback support, further reinforcing its importance as a key support level.
To the upside, the 1st resistance level at 1.3483 is identified as a pullback resistance while the 2nd resistance level at 1.3610 is noted as an overlap resistance, suggesting a potential barrier for further upside movement.
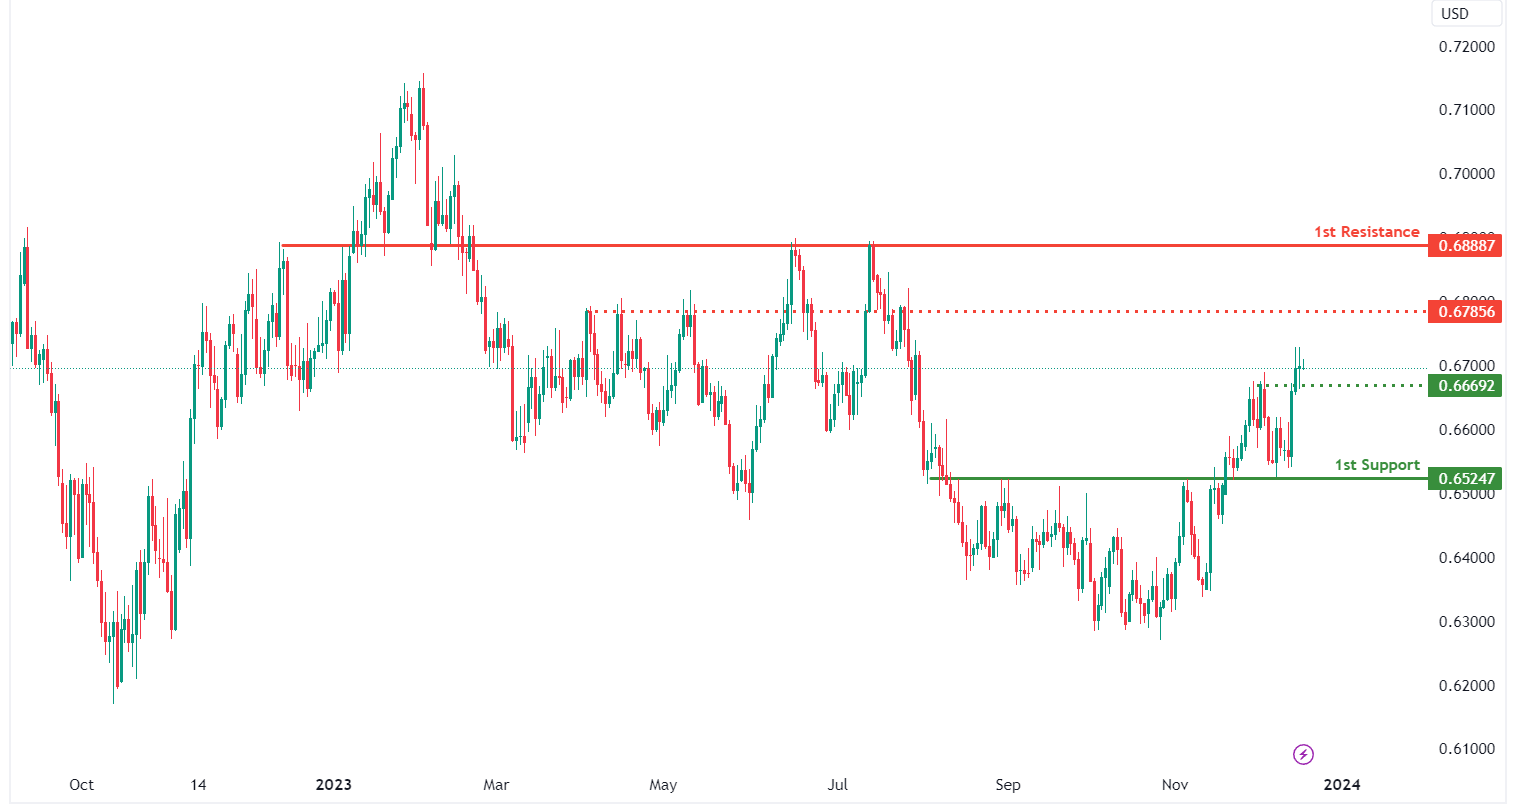
AUD/USD:
The AUD/USD chart currently exhibits an overall bullish momentum. In this context, there is a potential scenario for price to make a bullish continuation towards the intermediate resistance.
The intermediate resistance level at 0.6785 is identified as an overlap resistance. Higher up, the 1st resistance level at 0.6888 is also noted as an overlap resistance, indicating its potential significance as a barrier for further upward movement.
To the downside, the intermediate support level at 0.6669 is identified as an overlap support. Further below, the 1st support level at 0.6524 is also marked as an overlap support, further reinforcing its importance as a key support level.
NZD/USD:
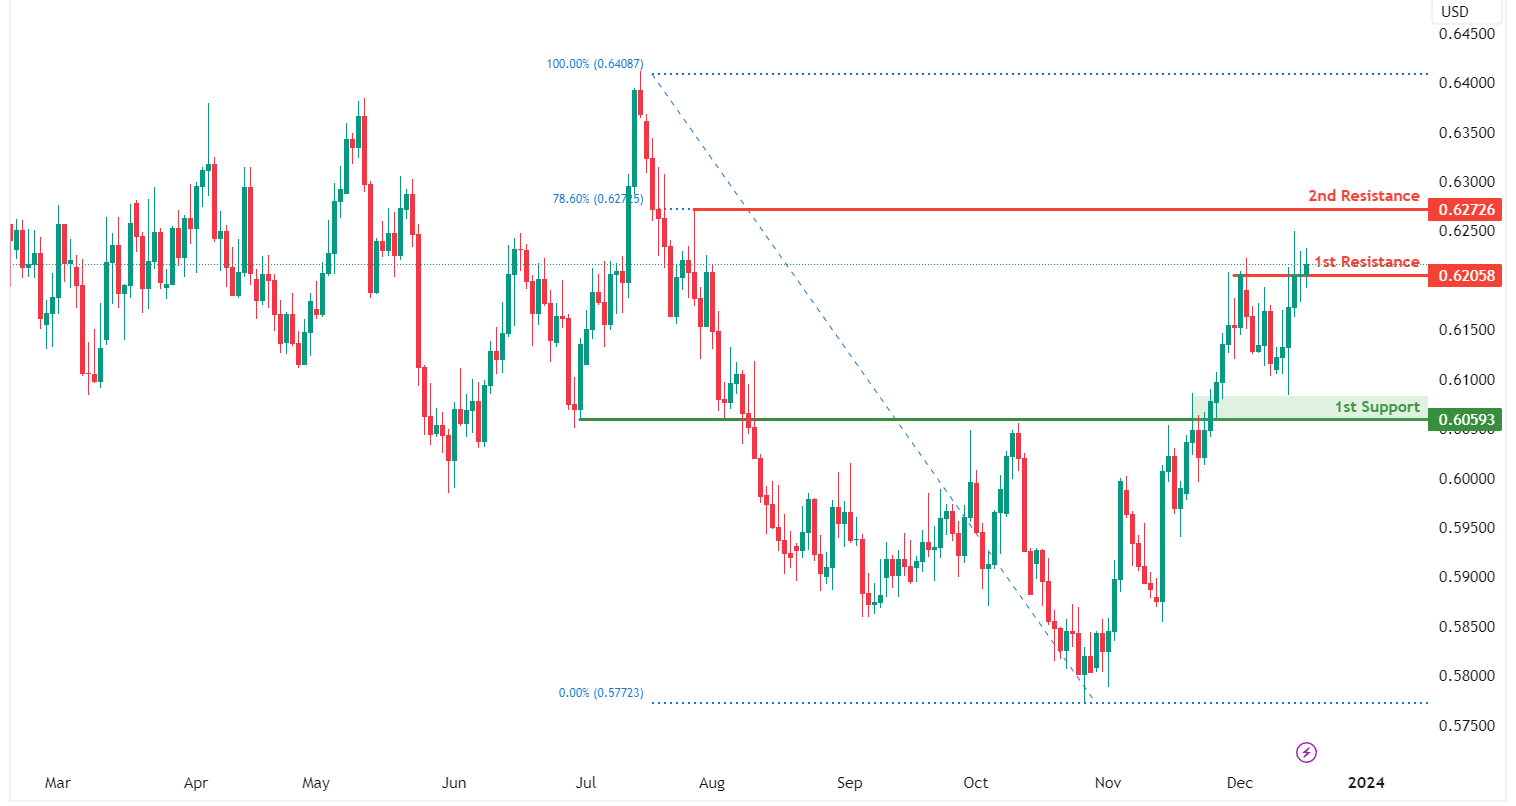
The NZD/USD chart currently exhibits an overall bullish momentum. In this context, there is a potential scenario for price to break above the 1st resistance and make a bullish continuation towards the 2nd resistance.
The 1st resistance level at 0.6205 is identified as a pullback resistance. Higher up, the 2nd resistance level at 0.6272 is also marked as a pullback resistance that aligns with the 78.60% Fibonacci retracement level, indicating its potential significance as a barrier for further upward movement.
To the downside, the 1st support level at 0.6059 is identified as an overlap support, further reinforcing its importance as a key support level.