
Nitin Spinners Limited
Nitin Spinners Limited has reached a peak and is continuing growing, it appears to be a fantastic long-term investment.
Please review and understand the structure of the Nitin Spinners Limited weekly chart. According to the chart, Nitin Spinners Limited is an excellent stock to purchase in the 380–390 range. It has shown remarkable performance thus far and has a significant upside potential.
Kindly consult the weekly chart supplied by Nitin Spinners Limited. The stock has been increasing since breaking out of the 380–390 zone, and it is currently trading above horizontal resistance. According to the data, Nitin Spinners Limited is presently trading for 380 and is in strong demand. This growth era is expected to continue until approximately 480–500, as shown in the graph below.
- Nitin Spinners Limited has sustained development and achieved a commendable breakthrough at 380-390, it is an excellent choice for long-term investments.
- Nitin Spinners Limited looks to be in a good place, with room to grow to 480 and 500.
- Right now, between 380 and 390 is the best moment to purchase this stock because the risk-reward ratio is ideal for cash transactions.
- With a target price range of 480 to 500, the chart indicates that the stock has broken out of an ascending triangle pattern.
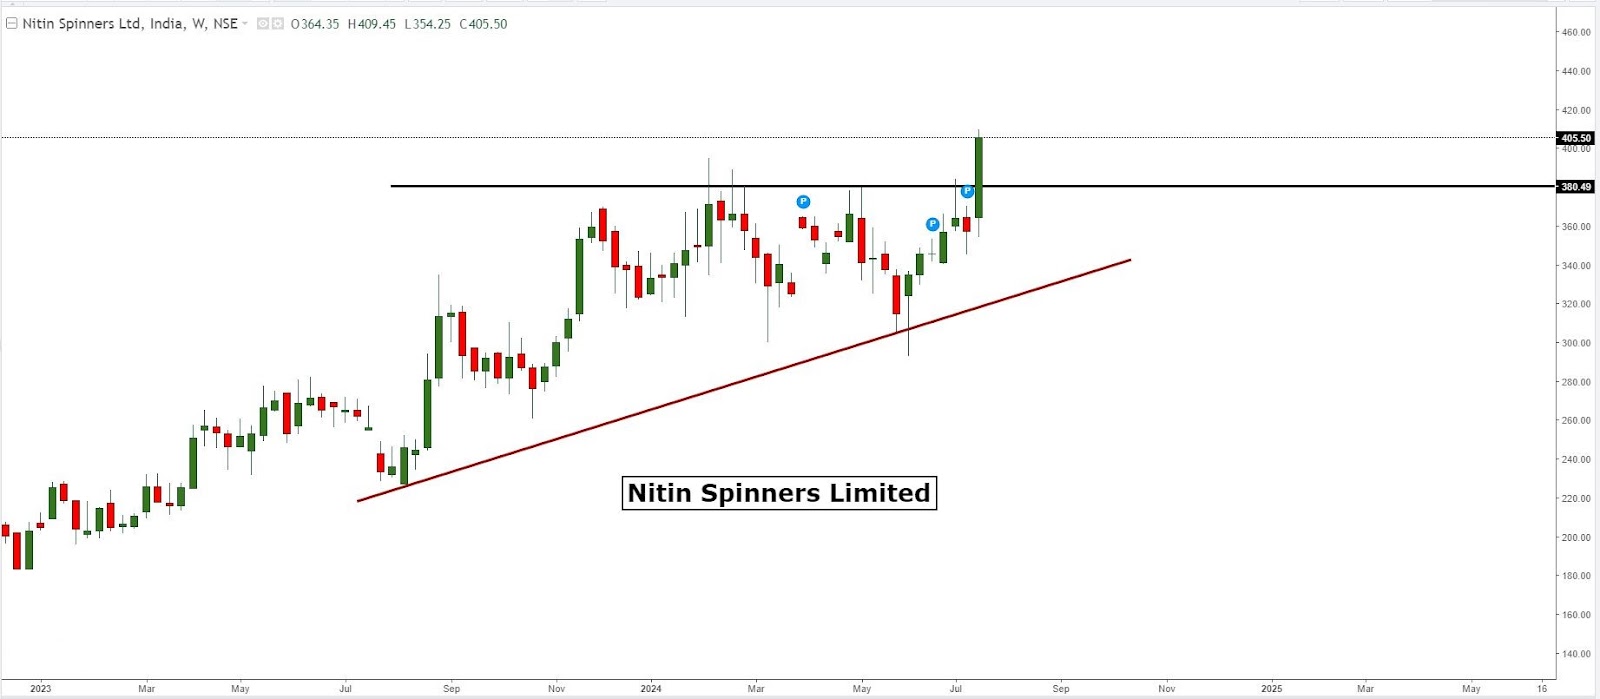
Kindly consult the weekly chart provided by Nitin Spinners Limited. The weekly chart displays demand in the 380–390 price range, as well as horizontal resistance and a breakout. Strong demand drives up the stock in that range.
This is a great time to buy as the stock has reached a new high, so please pay attention to the horizontal resistance and its breach. As of right now, the stock has reached its targets between 480 and 500 by following the chart's upward trend.
The rising triangle gave rise to Nitin Spinners Limited, with the pattern's most recent goals falling between 480 and 500. One chart pattern utilized in technical analysis is the rising triangle. At the swing high and low, price variations produce a horizontal line and a rising trend line, respectively. A triangle is formed by the two lines.
Owing to the stock's high demand, investors might be looking for a long-term purchasing opportunity in the 380–400 range and hoping to profit from any further falls. This might lead to a return to the 480 and 500 levels, demonstrating a favorable risk-reward ratio. This stock has a significant upside potential, therefore take advantage of every slump as an opportunity to invest. Invest any decline in shares of this company.
Investors may choose to progressively purchase the stock with cash, setting a stop loss of 330 and aiming for prices between 480 and 500.
As a trader or investor, I often look for a Volatility Contraction Pattern (VCP), which is a situation in which there is a decrease in price volatility before a significant gain, in order to allow the stock or instrument to attain high volume and upside with a quick increase and target hit. Please download the application from our website if you would like further information on VCP patterns. We also present the method of highly-precision pattern recognition.
The weekly chart for Nitin Spinners Limited displays both resistance and support. The levels are shown on the spot chart.
|
Nitin Spinners Limited |
Support |
Resistance |
|
Level 1 |
380 |
480 |
|
Level 2 |
330 |
500 |
Company Profile: The businesses that Nitin Spinners is involved in are yarn and cotton knitted fabric. Product Lineup. Yarn: Yarn made of mixed and 100% cotton is used to make terry towels, tea bags, denim, and other items. Single jersey knit fabric containing elastane. utilized in the production of winter, sports, infant, and innerwear, among other items.
Disclaimer: This expression is commonly used to convey that the content or material being seen is solely for educational reasons and should not be utilized for anything else. This example is just for educational purposes and should not be used commercially.