
Divis Laboratories Limited
Divis Laboratories Limited appears to be an excellent long-term investment, since the stock has reached an all-time high and continues to increase.
Please review the Divis Laboratories Limited daily chart and understand its structure. Divis Laboratories Limited, as shown in the chart, is a fantastic buy around the 4600-4620 range and has performed brilliantly thus far, with tremendous upside potential.
Please refer to Divis Laboratories Limited's daily chart. Following its breakout from the 4600-4620 zone, the stock is now trading above horizontal resistance and continues to rise. As indicated in the graph, Divis Laboratories Limited is currently in strong demand, with a price of 4620. The predicted growth range is 4830-4850, as seen in the chart below.
- Divis Laboratories Limited is an excellent long-term investment possibility because it experienced a reasonable breakout around the 4600-4620 area and is currently increasing.
- Divis Laboratories Limited appears to be in a strong position on the chart, with potential for additional increases to 4830 and 4850.
- As of now, 4600-4620 is the best opportunity to acquire this company because the risk-to-reward ratio is ideal for a cash deal.
- According to the chart, the stock has broken out of an ascending triangle pattern, with a target range of 4830-4850.
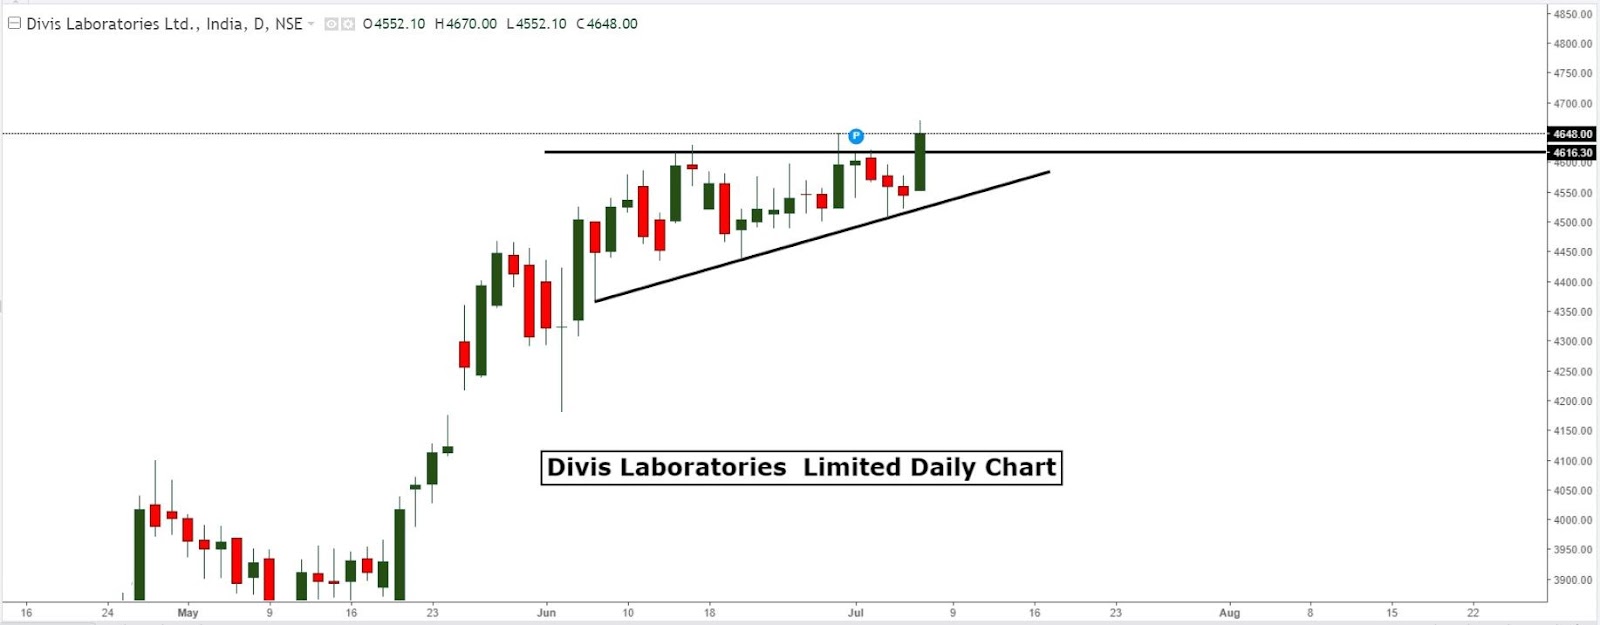
Please refer to the Divis Laboratories Limited daily chart for reference. The daily chart shows horizontal resistance, a breakout, and demand in the 4600-4620 range, with the stock increasing in reaction to strong demand in that area.
Please take note of the horizontal resistance and its breach, which resulted in the stock setting a new all-time high today, indicating a wonderful buying opportunity at the current price. So far, the stock has followed the chart's upward trend, reaching 4830 and 4850, the pattern's target levels.
Divis Laboratories Limited came from the ascending triangle, whose most recent aims ranged from 4830 to 4850. The ascending triangle is a chart pattern used for technical analysis. Price movements create a horizontal line at the swing high and a rising trend line at the swing low. The two lines form a triangle.
Investors may look for a long-term purchase opportunity in the 4600-4620 range and capitalize on any dips that occur as the stock is in strong demand, perhaps leading to a recovery to the 4830 and 4850 levels, indicating a positive risk-reward ratio. Use every dip to buy this stock since it has a high upside potential, and every dip is an opportunity to invest.
Investors could buy the stock with cash over time, establishing a stop loss at 4480 and aiming for price targets of 4830 to 4850.
As a trader or investor, I frequently look for a Volatility Contraction Pattern (VCP), which occurs when price volatility contracts before a significant gain, allowing the stock or instrument to achieve massive volume and upside with a quick increase and target hit. For additional information on VCP patterns, please visit our website and download the program. We also show how to recognize such patterns with great accuracy.
Divis Laboratories Limited's daily chart illustrates support and resistance. The spot chart depicts each level.
|
Divis Laboratories Limited |
Support |
Resistance |
|
Level 1 |
4500 |
4830 |
|
Level 2 |
4450 |
4850 |
Company Profile: Divi's has been in business for almost 30 years in Hyderabad, India, and has two manufacturing facilities. It is one of India's leading pharmaceutical enterprises. Divi's is acknowledged as a 'Reliable Supplier of generic APIs (Active pharmaceuticals ingredients)' and a 'Custom Manufacturer' to Big Pharma, as well as one of the world's top API manufacturers.
Divi's is the leading maker of APIs (active pharmaceutical ingredients), intermediates, and registered starting materials, serving over 100 countries with high-quality products that meet the highest standards of compliance and integrity. Divi just accomplished the milestone of becoming one of the top three API manufacturers in the globe as well as one of the top API firms in Hyderabad.
Disclaimer: This expression is commonly used to convey that the content or material being seen is solely for educational reasons and should not be utilized for anything else. This example is just for educational purposes and should not be used commercially.