
ACC Limited
ACC Limited appears to be an excellent long-term investment, since the stock has reached an all-time high and continues to grow.
Please review the ACC Limited weekly chart and understand its structure. ACC Limited, as shown in the chart, is a good buy in the 2740-2760 range, and it has performed brilliantly thus far, with significant upside potential.
Please check the ACC Limited weekly chart. Following its breakthrough from the 2740-2760 zone, the stock is currently trading above horizontal resistance and continues to rise. As indicated in the graph, ACC Limited is currently in strong demand at a price of 2750. The predicted increase is 3150-3200, as illustrated in the chart below.
- ACC Limited is an excellent long-term investment opportunity because it has experienced a reasonable breakout around the 2740-2760 level and is now increasing.
- ACC Limited appears to be in a solid position on the chart, with potential for further rises up to 3150 and 3200.
- As of now, 2740-2760 is the best opportunity to acquire this company because the risk-to-reward ratio is ideal for a cash transaction.
- According to the chart, one broke out of the ascending triangle pattern, with a goal range of 3150-3200.
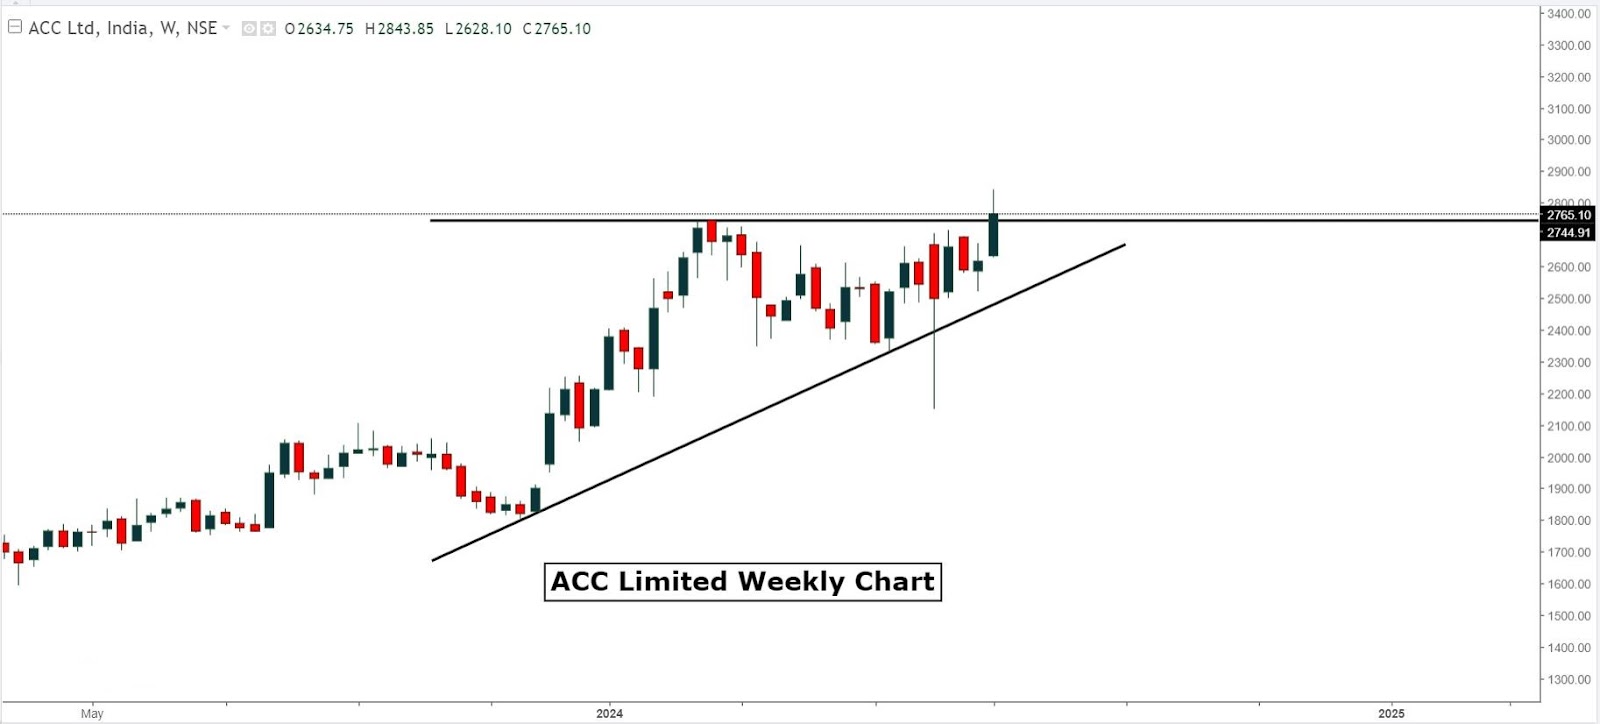
Please refer to the ACC Limited weekly chart for reference. The weekly chart shows horizontal resistance, a breakout, and demand in the 2740-2760 range, and the stock is gaining in reaction to the high demand in that area.
Please take note of the horizontal resistance and its breach, which resulted in the stock setting a new all-time high today, indicating a wonderful buying opportunity at the current market price. So far, the stock has followed the chart's upward trend, reaching 3150 and 3200, respectively, which is the pattern's target.
ACC Limited formed from the rising triangle, with the pattern's most recent targets ranging from 3150 to 3200. The ascending triangle is a chart pattern used for technical analysis. Price changes produce a horizontal line at the swing high and a rising trend line at the swing low. The two lines form a triangle.
Investors may look for a long-term purchase opportunity in the 2740-2760 range and capitalize on any dips that occur as the stock is in strong demand, perhaps leading to a recovery to the 3150 and 3200 levels, indicating a favorable risk-reward profile. Use every dip to buy this stock since it has a high upside potential, and every dip is an opportunity to invest.
Investors could buy the stock with cash over time and set a stop loss around 2480 to achieve price targets of 3150 to 3200.
As a trader or investor, I typically look for a VCP pattern, which is a Volatility Contraction Pattern in which price volatility contracts before to a significant gain, allowing the stock or instrument to achieve high volume and enormous upside with a quick rise and goal hit. To discover more about VCP patterns, please go to our website and download the app. We also show how to identify such patterns with great accuracy.
The ACC Limited weekly chart displays both support and resistance. The spot chart depicts each level.
|
ACC Limited |
Support |
Resistance |
|
Level 1 |
2480 |
3150 |
|
Level 2 |
2450 |
3200 |
Company Profile: ACC Limited (ACC) is a market leader in building materials in India, with operations and marketing spread across the country. It is a member of the Adani Group, which has the largest and fastest-growing portfolio of diverse sustainable enterprises. ACC, synonymous with cement, has built a reputation as a pioneering organization that has continuously set new standards for innovative research and product development. With over eight decades of knowledge and competence, ACC has made significant contributions to India's progress.
Disclaimer: This expression is commonly used to convey that the content or material being seen is solely for educational reasons and should not be utilized for anything else. This example is just for educational purposes and should not be used commercially.