
ICICI Lombard General Insurance Company Limited
ICICI Lombard General Insurance Company Limited appears to be a strong long-term investment, as the stock has reached its all-time high and is rising.
Please analyze the ICIL daily chart and understand its structure. As shown in the chart, ICIL is a solid buy around the 1730-1750 range, and it has performed well thus far, with tremendous upside potential.
Please examine the ICICI Lombard General Insurance Company Limited daily chart. Following its breakout from the 1730-1750 zone, the stock is trading above horizontal resistance and continuing to rise. As indicated in the graph, ICIL is presently in high demand in the 1735 price range. The predicted gain is 1980-2000, as illustrated in the chart below.
- ICIL is an excellent long-term investment opportunity because it has shown a reasonable breakout around the 1730-1750 level and is currently on the rise.
- ICIL appears to be in a solid position on the chart, with potential for additional increase to 1980 and 2000.
- As of now, 1730-1750 is the best opportunity to acquire this company because the risk-to-reward ratio was ideal for a cash transaction.
- According to the chart, ICIL broke out of the ascending triangle pattern, with a goal range of 1980 to 2000.
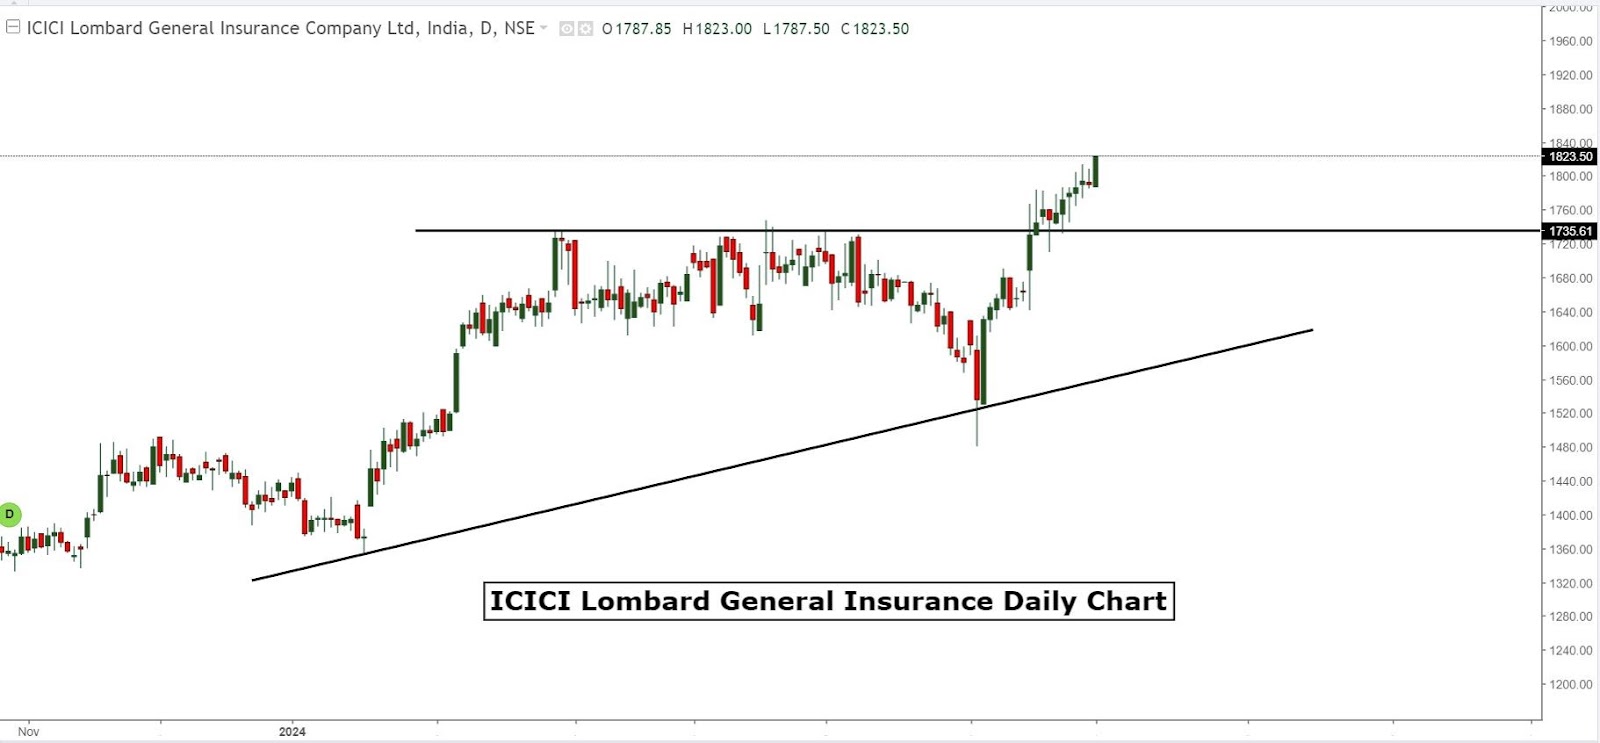
Please refer to the ICIL daily chart for reference. The daily chart shows horizontal resistance and breakout, as well as demand in the 1730-1750 range, and the stock is increasing after taking into consideration the significant demand in that region.
Please take note of the horizontal resistance and its breach, which resulted in the stock establishing a new all-time high today, indicating an excellent opportunity to buy at the current market price. So far, the stock has followed the chart's upward trend, reaching 1980 and 2000, respectively, meeting the pattern's objective.
ICIL came from the rising triangle, and the pattern's current goal ranges between 1980 and 2000. The ascending triangle is a chart pattern used for technical analysis. Price movements create a horizontal line at the swing highs and a rising trend line at the swing lows. The two lines form a triangle.
Investors may look for a long-term purchase opportunity in the 1730-1750 range and profit on any dips that occur as the stock is in high demand, perhaps leading to a recovery to the 1980 and 2000 levels, indicating a strong risk-reward ratio. Use every dip to buy this stock since it has a high upside potential, and every dip is an opportunity to invest.
Investors could buy the stock with cash over time and put a stop loss at 1640 to accomplish price goals ranging from 1980 to 2000.
The ICIL daily chart shows both support and resistance. The spot chart illustrates each level.
|
ICIL |
Support |
Resistance |
|
Level 1 |
1650 |
1950 |
|
Level 2 |
1640 |
2000 |
Company Profile: ICICI Lombard General Insurance Company Limited is a general insurance provider in India. It specializes in general insurance, reinsurance, insurance claims management, and investment management.
The company has a Gross Written Premium (GWP) of ₹217.71 billion for FY2023. It provides policy insurance and renewal services through its intermediaries and website. It offers insurance goods such as car insurance, health insurance, international travel insurance, overseas student travel insurance, two-wheeler insurance, home insurance, and weather insurance.
Disclaimer: This expression is commonly used to convey that the content or material being seen is solely for educational reasons and should not be utilized for anything else. This example is just for educational purposes and should not be used commercially.